Immigrants from Guyana vs Ethiopian Unemployment
COMPARE
Immigrants from Guyana
Ethiopian
Unemployment
Unemployment Comparison
Immigrants from Guyana
Ethiopians
6.9%
UNEMPLOYMENT
0.0/ 100
METRIC RATING
321st/ 347
METRIC RANK
5.1%
UNEMPLOYMENT
88.6/ 100
METRIC RATING
124th/ 347
METRIC RANK
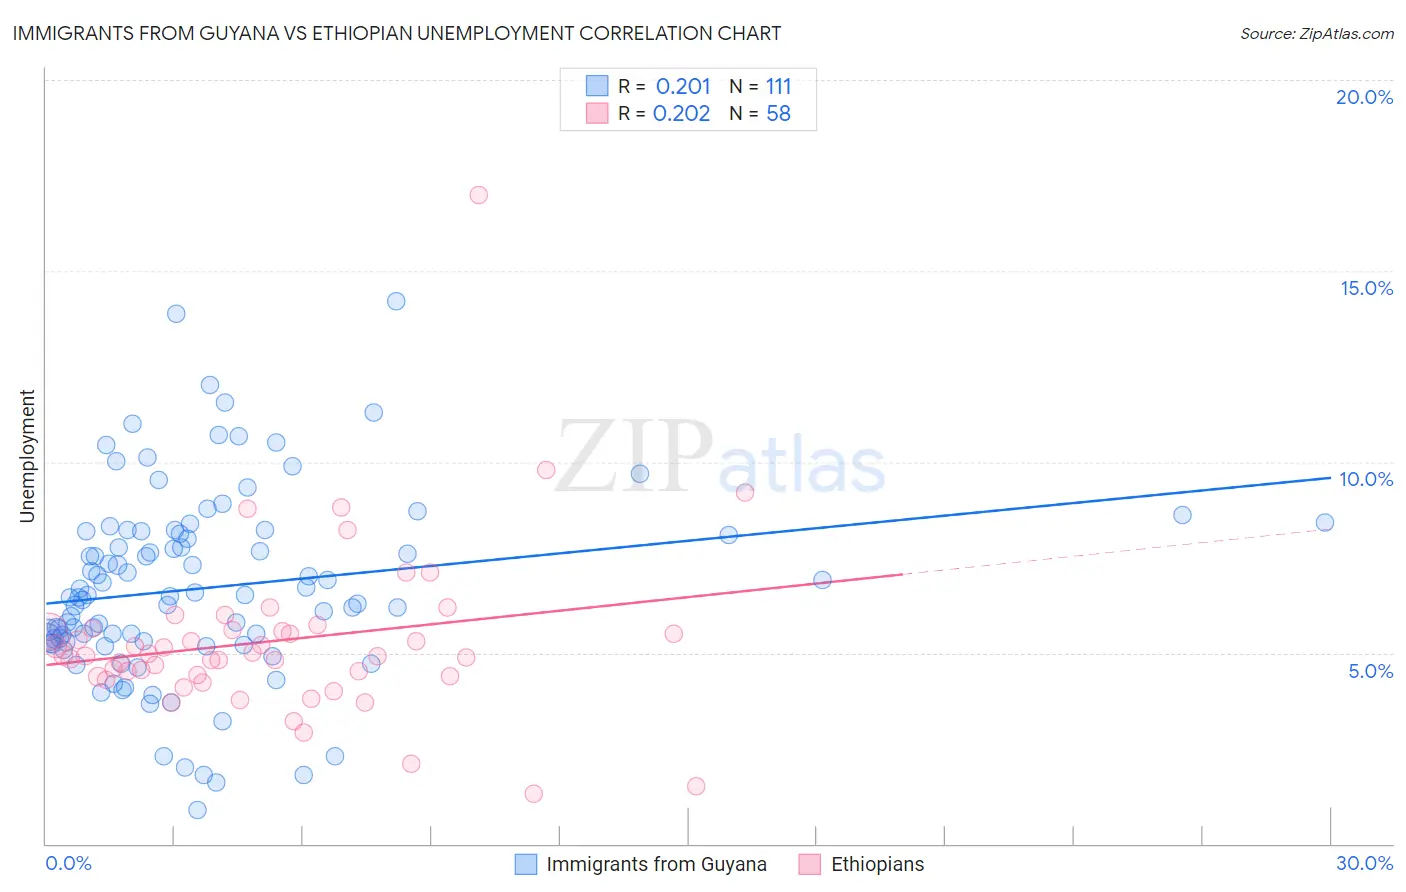
Immigrants from Guyana vs Ethiopian Unemployment Correlation Chart
The statistical analysis conducted on geographies consisting of 183,677,376 people shows a weak positive correlation between the proportion of Immigrants from Guyana and unemployment in the United States with a correlation coefficient (R) of 0.201 and weighted average of 6.9%. Similarly, the statistical analysis conducted on geographies consisting of 223,178,057 people shows a weak positive correlation between the proportion of Ethiopians and unemployment in the United States with a correlation coefficient (R) of 0.202 and weighted average of 5.1%, a difference of 35.3%.
Unemployment Correlation Summary
| Measurement | Immigrants from Guyana | Ethiopian |
| Minimum | 0.90% | 1.3% |
| Maximum | 14.2% | 17.0% |
| Range | 13.3% | 15.7% |
| Mean | 6.7% | 5.3% |
| Median | 6.5% | 4.9% |
| Interquartile 25% (IQ1) | 5.3% | 4.4% |
| Interquartile 75% (IQ3) | 8.2% | 5.6% |
| Interquartile Range (IQR) | 2.9% | 1.2% |
| Standard Deviation (Sample) | 2.5% | 2.2% |
| Standard Deviation (Population) | 2.5% | 2.2% |
Similar Demographics by Unemployment
Demographics Similar to Immigrants from Guyana by Unemployment
In terms of unemployment, the demographic groups most similar to Immigrants from Guyana are Immigrants from St. Vincent and the Grenadines (6.9%, a difference of 0.010%), Guyanese (6.9%, a difference of 0.040%), Immigrants from Grenada (6.9%, a difference of 0.36%), British West Indian (6.8%, a difference of 0.81%), and Immigrants from Cabo Verde (6.8%, a difference of 1.0%).
| Demographics | Rating | Rank | Unemployment |
| Blacks/African Americans | 0.0 /100 | #314 | Tragic 6.6% |
| Houma | 0.0 /100 | #315 | Tragic 6.7% |
| Immigrants | Dominica | 0.0 /100 | #316 | Tragic 6.7% |
| Shoshone | 0.0 /100 | #317 | Tragic 6.8% |
| Immigrants | Cabo Verde | 0.0 /100 | #318 | Tragic 6.8% |
| British West Indians | 0.0 /100 | #319 | Tragic 6.8% |
| Immigrants | St. Vincent and the Grenadines | 0.0 /100 | #320 | Tragic 6.9% |
| Immigrants | Guyana | 0.0 /100 | #321 | Tragic 6.9% |
| Guyanese | 0.0 /100 | #322 | Tragic 6.9% |
| Immigrants | Grenada | 0.0 /100 | #323 | Tragic 6.9% |
| Immigrants | Armenia | 0.0 /100 | #324 | Tragic 7.0% |
| Natives/Alaskans | 0.0 /100 | #325 | Tragic 7.0% |
| Paiute | 0.0 /100 | #326 | Tragic 7.1% |
| Pueblo | 0.0 /100 | #327 | Tragic 7.2% |
| Tsimshian | 0.0 /100 | #328 | Tragic 7.2% |
Demographics Similar to Ethiopians by Unemployment
In terms of unemployment, the demographic groups most similar to Ethiopians are Asian (5.1%, a difference of 0.050%), Immigrants from Eastern Asia (5.1%, a difference of 0.050%), Kenyan (5.1%, a difference of 0.070%), Immigrants from Kenya (5.1%, a difference of 0.070%), and Immigrants from Switzerland (5.1%, a difference of 0.080%).
| Demographics | Rating | Rank | Unemployment |
| Immigrants | Malaysia | 91.0 /100 | #117 | Exceptional 5.1% |
| Immigrants | Germany | 90.8 /100 | #118 | Exceptional 5.1% |
| Immigrants | France | 89.7 /100 | #119 | Excellent 5.1% |
| Macedonians | 89.7 /100 | #120 | Excellent 5.1% |
| Lebanese | 89.2 /100 | #121 | Excellent 5.1% |
| Immigrants | Switzerland | 89.1 /100 | #122 | Excellent 5.1% |
| Asians | 89.0 /100 | #123 | Excellent 5.1% |
| Ethiopians | 88.6 /100 | #124 | Excellent 5.1% |
| Immigrants | Eastern Asia | 88.3 /100 | #125 | Excellent 5.1% |
| Kenyans | 88.2 /100 | #126 | Excellent 5.1% |
| Immigrants | Kenya | 88.2 /100 | #127 | Excellent 5.1% |
| Immigrants | Eastern Africa | 88.1 /100 | #128 | Excellent 5.1% |
| Immigrants | Latvia | 88.0 /100 | #129 | Excellent 5.1% |
| Iranians | 86.9 /100 | #130 | Excellent 5.1% |
| Immigrants | Croatia | 86.8 /100 | #131 | Excellent 5.1% |