Immigrants from Guyana vs Yuman Unemployment Among Ages 25 to 29 years
COMPARE
Immigrants from Guyana
Yuman
Unemployment Among Ages 25 to 29 years
Unemployment Among Ages 25 to 29 years Comparison
Immigrants from Guyana
Yuman
8.5%
UNEMPLOYMENT AMONG AGES 25 TO 29 YEARS
0.0/ 100
METRIC RATING
317th/ 347
METRIC RANK
11.0%
UNEMPLOYMENT AMONG AGES 25 TO 29 YEARS
0.0/ 100
METRIC RATING
334th/ 347
METRIC RANK
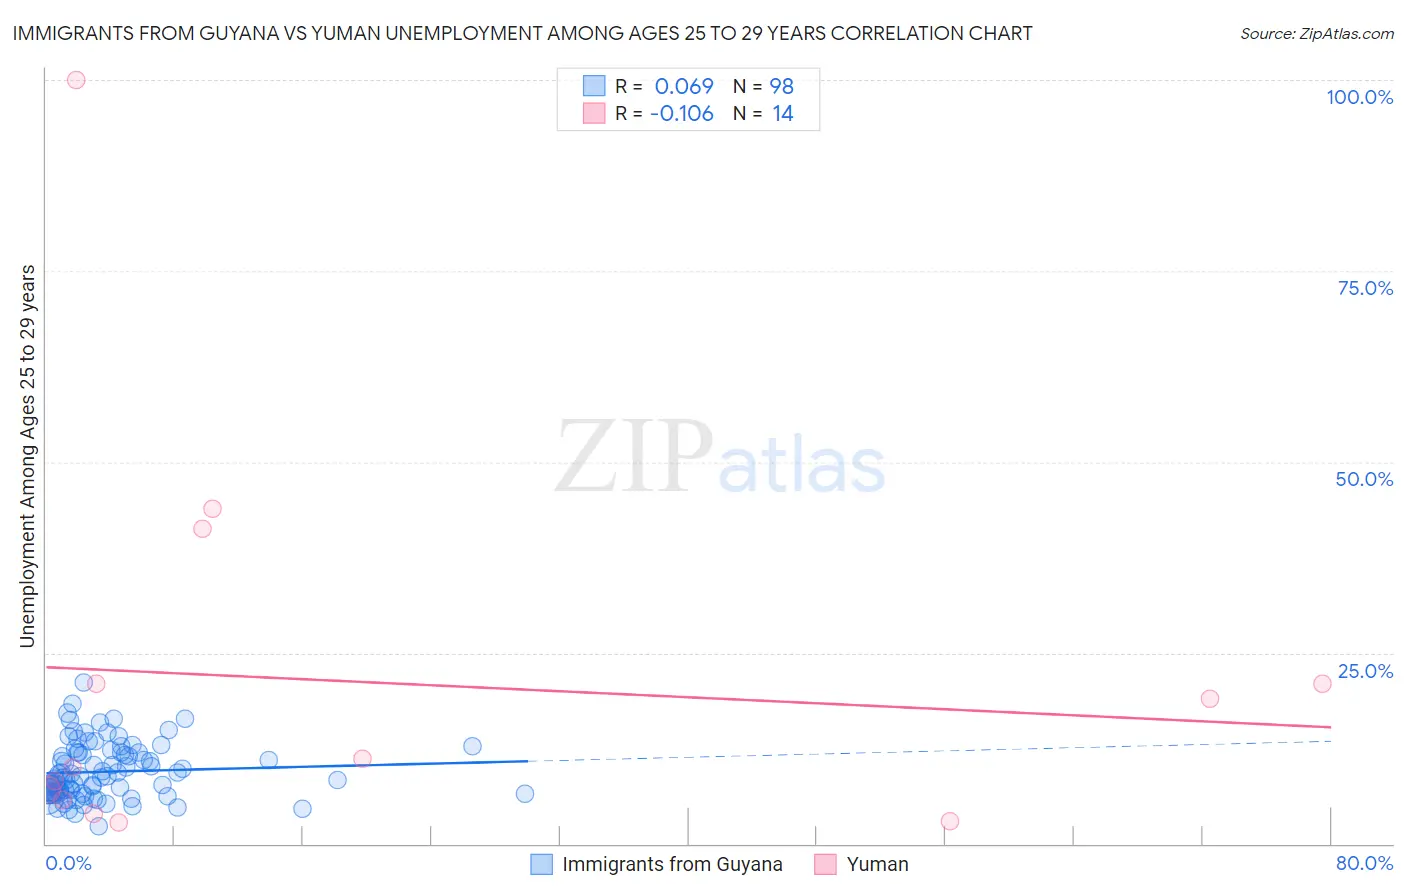
Immigrants from Guyana vs Yuman Unemployment Among Ages 25 to 29 years Correlation Chart
The statistical analysis conducted on geographies consisting of 179,255,747 people shows a slight positive correlation between the proportion of Immigrants from Guyana and unemployment rate among population between the ages 25 and 29 in the United States with a correlation coefficient (R) of 0.069 and weighted average of 8.5%. Similarly, the statistical analysis conducted on geographies consisting of 40,399,570 people shows a poor negative correlation between the proportion of Yuman and unemployment rate among population between the ages 25 and 29 in the United States with a correlation coefficient (R) of -0.106 and weighted average of 11.0%, a difference of 30.1%.
Unemployment Among Ages 25 to 29 years Correlation Summary
| Measurement | Immigrants from Guyana | Yuman |
| Minimum | 2.3% | 2.8% |
| Maximum | 21.1% | 100.0% |
| Range | 18.8% | 97.2% |
| Mean | 9.4% | 21.3% |
| Median | 8.7% | 10.5% |
| Interquartile 25% (IQ1) | 6.6% | 5.8% |
| Interquartile 75% (IQ3) | 12.0% | 21.0% |
| Interquartile Range (IQR) | 5.3% | 15.2% |
| Standard Deviation (Sample) | 3.6% | 26.2% |
| Standard Deviation (Population) | 3.6% | 25.3% |
Demographics Similar to Immigrants from Guyana and Yuman by Unemployment Among Ages 25 to 29 years
In terms of unemployment among ages 25 to 29 years, the demographic groups most similar to Immigrants from Guyana are Immigrants from Grenada (8.4%, a difference of 0.090%), British West Indian (8.4%, a difference of 0.15%), Guyanese (8.5%, a difference of 0.26%), Immigrants from Armenia (8.5%, a difference of 0.48%), and Black/African American (8.6%, a difference of 1.2%). Similarly, the demographic groups most similar to Yuman are Puerto Rican (11.1%, a difference of 1.1%), Alaskan Athabascan (10.8%, a difference of 2.0%), Pueblo (10.4%, a difference of 5.4%), Alaska Native (10.2%, a difference of 7.9%), and Native/Alaskan (9.8%, a difference of 11.9%).
| Demographics | Rating | Rank | Unemployment Among Ages 25 to 29 years |
| British West Indians | 0.0 /100 | #315 | Tragic 8.4% |
| Immigrants | Grenada | 0.0 /100 | #316 | Tragic 8.4% |
| Immigrants | Guyana | 0.0 /100 | #317 | Tragic 8.5% |
| Guyanese | 0.0 /100 | #318 | Tragic 8.5% |
| Immigrants | Armenia | 0.0 /100 | #319 | Tragic 8.5% |
| Blacks/African Americans | 0.0 /100 | #320 | Tragic 8.6% |
| Immigrants | Dominican Republic | 0.0 /100 | #321 | Tragic 8.6% |
| Tlingit-Haida | 0.0 /100 | #322 | Tragic 8.7% |
| Dominicans | 0.0 /100 | #323 | Tragic 8.7% |
| Houma | 0.0 /100 | #324 | Tragic 8.7% |
| Yakama | 0.0 /100 | #325 | Tragic 8.8% |
| Shoshone | 0.0 /100 | #326 | Tragic 9.2% |
| Colville | 0.0 /100 | #327 | Tragic 9.2% |
| Apache | 0.0 /100 | #328 | Tragic 9.5% |
| Aleuts | 0.0 /100 | #329 | Tragic 9.7% |
| Natives/Alaskans | 0.0 /100 | #330 | Tragic 9.8% |
| Alaska Natives | 0.0 /100 | #331 | Tragic 10.2% |
| Pueblo | 0.0 /100 | #332 | Tragic 10.4% |
| Alaskan Athabascans | 0.0 /100 | #333 | Tragic 10.8% |
| Yuman | 0.0 /100 | #334 | Tragic 11.0% |
| Puerto Ricans | 0.0 /100 | #335 | Tragic 11.1% |