Immigrants from Grenada vs Immigrants from Afghanistan Unemployment
COMPARE
Immigrants from Grenada
Immigrants from Afghanistan
Unemployment
Unemployment Comparison
Immigrants from Grenada
Immigrants from Afghanistan
6.9%
UNEMPLOYMENT
0.0/ 100
METRIC RATING
323rd/ 347
METRIC RANK
5.3%
UNEMPLOYMENT
28.6/ 100
METRIC RATING
199th/ 347
METRIC RANK
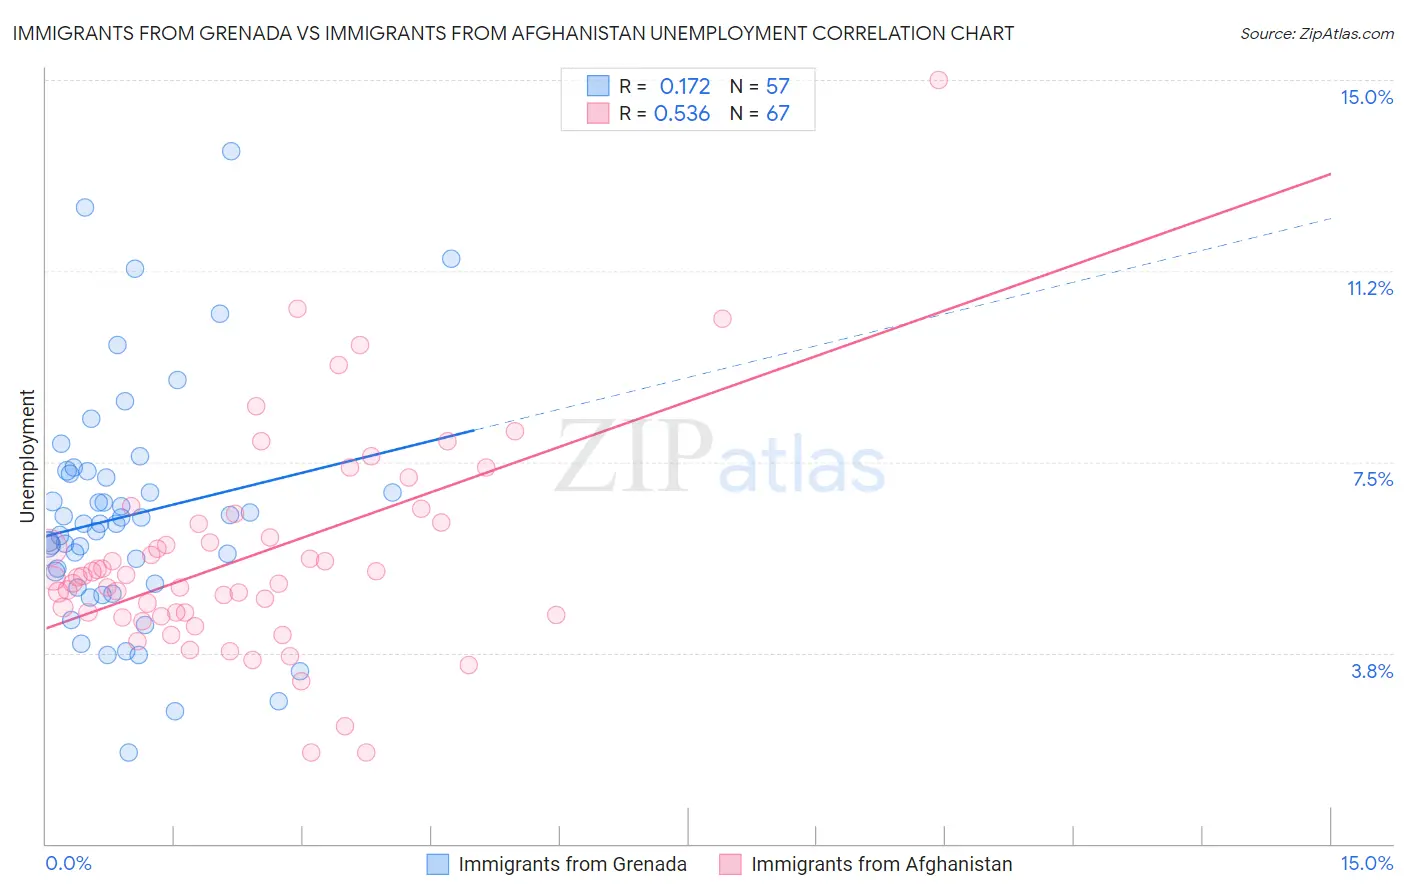
Immigrants from Grenada vs Immigrants from Afghanistan Unemployment Correlation Chart
The statistical analysis conducted on geographies consisting of 67,187,292 people shows a poor positive correlation between the proportion of Immigrants from Grenada and unemployment in the United States with a correlation coefficient (R) of 0.172 and weighted average of 6.9%. Similarly, the statistical analysis conducted on geographies consisting of 147,628,423 people shows a substantial positive correlation between the proportion of Immigrants from Afghanistan and unemployment in the United States with a correlation coefficient (R) of 0.536 and weighted average of 5.3%, a difference of 29.7%.
Unemployment Correlation Summary
| Measurement | Immigrants from Grenada | Immigrants from Afghanistan |
| Minimum | 1.8% | 1.8% |
| Maximum | 13.6% | 15.0% |
| Range | 11.8% | 13.2% |
| Mean | 6.4% | 5.6% |
| Median | 6.3% | 5.2% |
| Interquartile 25% (IQ1) | 5.1% | 4.5% |
| Interquartile 75% (IQ3) | 7.3% | 6.3% |
| Interquartile Range (IQR) | 2.2% | 1.8% |
| Standard Deviation (Sample) | 2.3% | 2.1% |
| Standard Deviation (Population) | 2.3% | 2.1% |
Similar Demographics by Unemployment
Demographics Similar to Immigrants from Grenada by Unemployment
In terms of unemployment, the demographic groups most similar to Immigrants from Grenada are Guyanese (6.9%, a difference of 0.32%), Immigrants from Guyana (6.9%, a difference of 0.36%), Immigrants from St. Vincent and the Grenadines (6.9%, a difference of 0.37%), Immigrants from Armenia (7.0%, a difference of 1.2%), and British West Indian (6.8%, a difference of 1.2%).
| Demographics | Rating | Rank | Unemployment |
| Immigrants | Dominica | 0.0 /100 | #316 | Tragic 6.7% |
| Shoshone | 0.0 /100 | #317 | Tragic 6.8% |
| Immigrants | Cabo Verde | 0.0 /100 | #318 | Tragic 6.8% |
| British West Indians | 0.0 /100 | #319 | Tragic 6.8% |
| Immigrants | St. Vincent and the Grenadines | 0.0 /100 | #320 | Tragic 6.9% |
| Immigrants | Guyana | 0.0 /100 | #321 | Tragic 6.9% |
| Guyanese | 0.0 /100 | #322 | Tragic 6.9% |
| Immigrants | Grenada | 0.0 /100 | #323 | Tragic 6.9% |
| Immigrants | Armenia | 0.0 /100 | #324 | Tragic 7.0% |
| Natives/Alaskans | 0.0 /100 | #325 | Tragic 7.0% |
| Paiute | 0.0 /100 | #326 | Tragic 7.1% |
| Pueblo | 0.0 /100 | #327 | Tragic 7.2% |
| Tsimshian | 0.0 /100 | #328 | Tragic 7.2% |
| Alaska Natives | 0.0 /100 | #329 | Tragic 7.2% |
| Yakama | 0.0 /100 | #330 | Tragic 7.3% |
Demographics Similar to Immigrants from Afghanistan by Unemployment
In terms of unemployment, the demographic groups most similar to Immigrants from Afghanistan are Immigrants from Israel (5.3%, a difference of 0.0%), Immigrants from Uruguay (5.3%, a difference of 0.090%), Korean (5.3%, a difference of 0.090%), Peruvian (5.3%, a difference of 0.10%), and Immigrants from South Eastern Asia (5.3%, a difference of 0.12%).
| Demographics | Rating | Rank | Unemployment |
| South Americans | 33.9 /100 | #192 | Fair 5.3% |
| Immigrants | Somalia | 33.8 /100 | #193 | Fair 5.3% |
| Immigrants | Laos | 30.9 /100 | #194 | Fair 5.3% |
| Immigrants | Southern Europe | 30.9 /100 | #195 | Fair 5.3% |
| Peruvians | 29.9 /100 | #196 | Fair 5.3% |
| Immigrants | Uruguay | 29.8 /100 | #197 | Fair 5.3% |
| Immigrants | Israel | 28.6 /100 | #198 | Fair 5.3% |
| Immigrants | Afghanistan | 28.6 /100 | #199 | Fair 5.3% |
| Koreans | 27.4 /100 | #200 | Fair 5.3% |
| Immigrants | South Eastern Asia | 27.0 /100 | #201 | Fair 5.3% |
| Cherokee | 25.5 /100 | #202 | Fair 5.3% |
| Immigrants | Micronesia | 25.2 /100 | #203 | Fair 5.3% |
| Immigrants | Ukraine | 24.9 /100 | #204 | Fair 5.3% |
| Native Hawaiians | 24.1 /100 | #205 | Fair 5.3% |
| Immigrants | Peru | 22.7 /100 | #206 | Fair 5.4% |