Immigrants from Ghana vs West Indian Family Households with Children
COMPARE
Immigrants from Ghana
West Indian
Family Households with Children
Family Households with Children Comparison
Immigrants from Ghana
West Indians
28.6%
FAMILY HOUSEHOLDS WITH CHILDREN
99.9/ 100
METRIC RATING
61st/ 347
METRIC RANK
26.3%
FAMILY HOUSEHOLDS WITH CHILDREN
0.0/ 100
METRIC RATING
307th/ 347
METRIC RANK
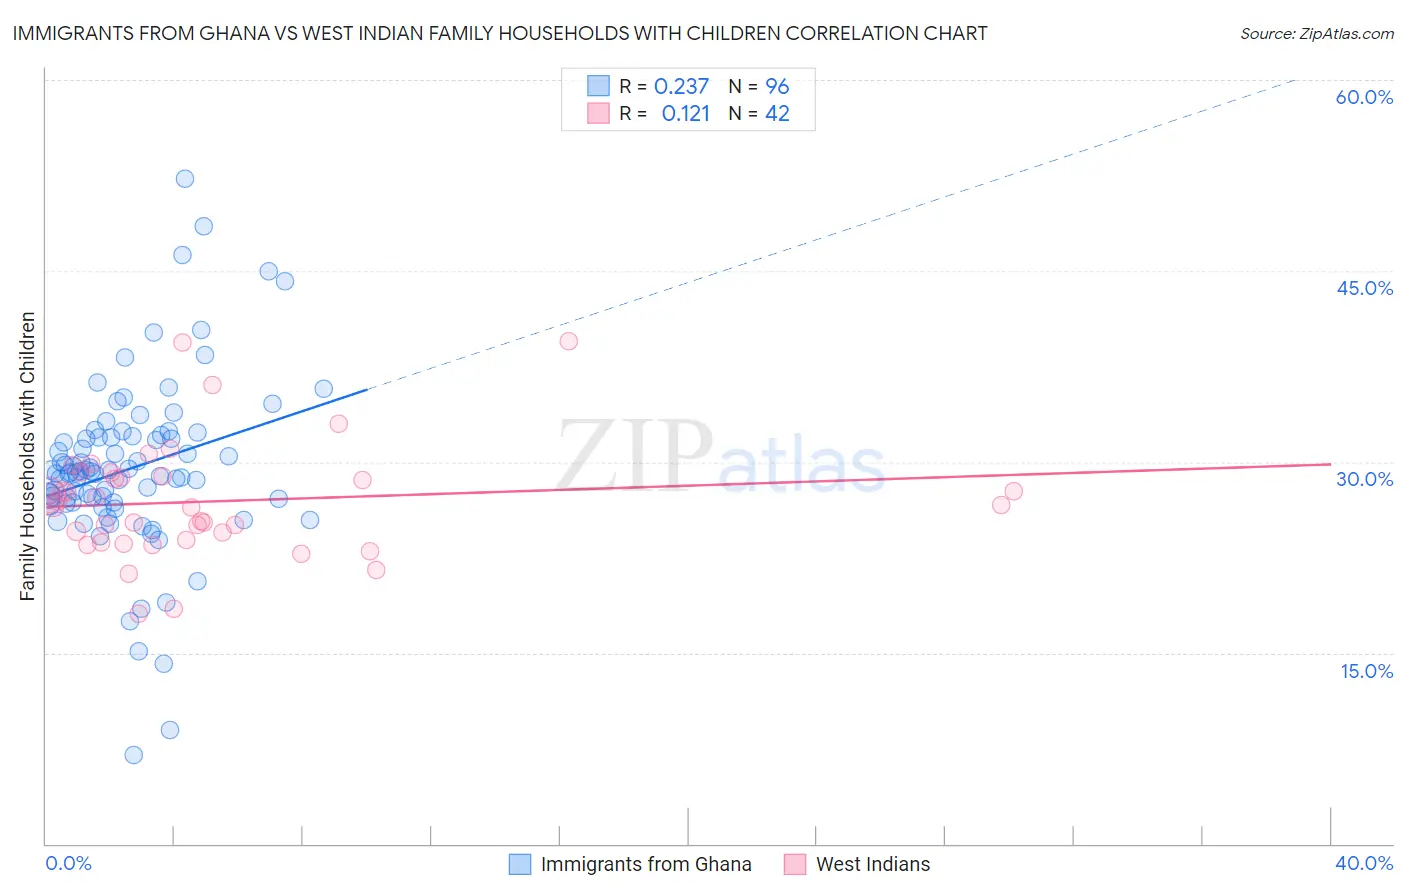
Immigrants from Ghana vs West Indian Family Households with Children Correlation Chart
The statistical analysis conducted on geographies consisting of 199,783,452 people shows a weak positive correlation between the proportion of Immigrants from Ghana and percentage of family households with children in the United States with a correlation coefficient (R) of 0.237 and weighted average of 28.6%. Similarly, the statistical analysis conducted on geographies consisting of 253,803,119 people shows a poor positive correlation between the proportion of West Indians and percentage of family households with children in the United States with a correlation coefficient (R) of 0.121 and weighted average of 26.3%, a difference of 8.7%.
Family Households with Children Correlation Summary
| Measurement | Immigrants from Ghana | West Indian |
| Minimum | 7.0% | 18.0% |
| Maximum | 52.2% | 39.5% |
| Range | 45.3% | 21.5% |
| Mean | 29.5% | 26.9% |
| Median | 29.1% | 26.5% |
| Interquartile 25% (IQ1) | 26.8% | 23.9% |
| Interquartile 75% (IQ3) | 31.9% | 28.9% |
| Interquartile Range (IQR) | 5.2% | 5.0% |
| Standard Deviation (Sample) | 6.9% | 4.5% |
| Standard Deviation (Population) | 6.9% | 4.5% |
Similar Demographics by Family Households with Children
Demographics Similar to Immigrants from Ghana by Family Households with Children
In terms of family households with children, the demographic groups most similar to Immigrants from Ghana are Egyptian (28.6%, a difference of 0.0%), Immigrants from Lebanon (28.6%, a difference of 0.010%), Hmong (28.6%, a difference of 0.070%), Filipino (28.6%, a difference of 0.080%), and Immigrants from Nigeria (28.6%, a difference of 0.13%).
| Demographics | Rating | Rank | Family Households with Children |
| Sierra Leoneans | 100.0 /100 | #54 | Exceptional 28.9% |
| Immigrants | Asia | 100.0 /100 | #55 | Exceptional 28.8% |
| Immigrants | Guatemala | 100.0 /100 | #56 | Exceptional 28.8% |
| Danes | 100.0 /100 | #57 | Exceptional 28.7% |
| Hawaiians | 100.0 /100 | #58 | Exceptional 28.7% |
| Immigrants | Nigeria | 100.0 /100 | #59 | Exceptional 28.6% |
| Hmong | 99.9 /100 | #60 | Exceptional 28.6% |
| Immigrants | Ghana | 99.9 /100 | #61 | Exceptional 28.6% |
| Egyptians | 99.9 /100 | #62 | Exceptional 28.6% |
| Immigrants | Lebanon | 99.9 /100 | #63 | Exceptional 28.6% |
| Filipinos | 99.9 /100 | #64 | Exceptional 28.6% |
| Hondurans | 99.9 /100 | #65 | Exceptional 28.5% |
| Immigrants | Egypt | 99.9 /100 | #66 | Exceptional 28.5% |
| Ghanaians | 99.9 /100 | #67 | Exceptional 28.5% |
| Houma | 99.9 /100 | #68 | Exceptional 28.5% |
Demographics Similar to West Indians by Family Households with Children
In terms of family households with children, the demographic groups most similar to West Indians are Lumbee (26.3%, a difference of 0.020%), Bermudan (26.3%, a difference of 0.080%), Guyanese (26.3%, a difference of 0.10%), Immigrants from Bahamas (26.3%, a difference of 0.12%), and Immigrants from Somalia (26.3%, a difference of 0.13%).
| Demographics | Rating | Rank | Family Households with Children |
| Paiute | 0.1 /100 | #300 | Tragic 26.4% |
| Immigrants | Trinidad and Tobago | 0.1 /100 | #301 | Tragic 26.4% |
| Serbians | 0.1 /100 | #302 | Tragic 26.4% |
| Immigrants | Guyana | 0.1 /100 | #303 | Tragic 26.3% |
| Immigrants | Bahamas | 0.1 /100 | #304 | Tragic 26.3% |
| Guyanese | 0.1 /100 | #305 | Tragic 26.3% |
| Bermudans | 0.1 /100 | #306 | Tragic 26.3% |
| West Indians | 0.0 /100 | #307 | Tragic 26.3% |
| Lumbee | 0.0 /100 | #308 | Tragic 26.3% |
| Immigrants | Somalia | 0.0 /100 | #309 | Tragic 26.3% |
| Marshallese | 0.0 /100 | #310 | Tragic 26.2% |
| Colville | 0.0 /100 | #311 | Tragic 26.2% |
| Immigrants | Czechoslovakia | 0.0 /100 | #312 | Tragic 26.2% |
| Cree | 0.0 /100 | #313 | Tragic 26.2% |
| French Canadians | 0.0 /100 | #314 | Tragic 26.1% |