Immigrants from Fiji vs Immigrants from Guyana Unemployment
COMPARE
Immigrants from Fiji
Immigrants from Guyana
Unemployment
Unemployment Comparison
Immigrants from Fiji
Immigrants from Guyana
5.9%
UNEMPLOYMENT
0.0/ 100
METRIC RATING
273rd/ 347
METRIC RANK
6.9%
UNEMPLOYMENT
0.0/ 100
METRIC RATING
321st/ 347
METRIC RANK
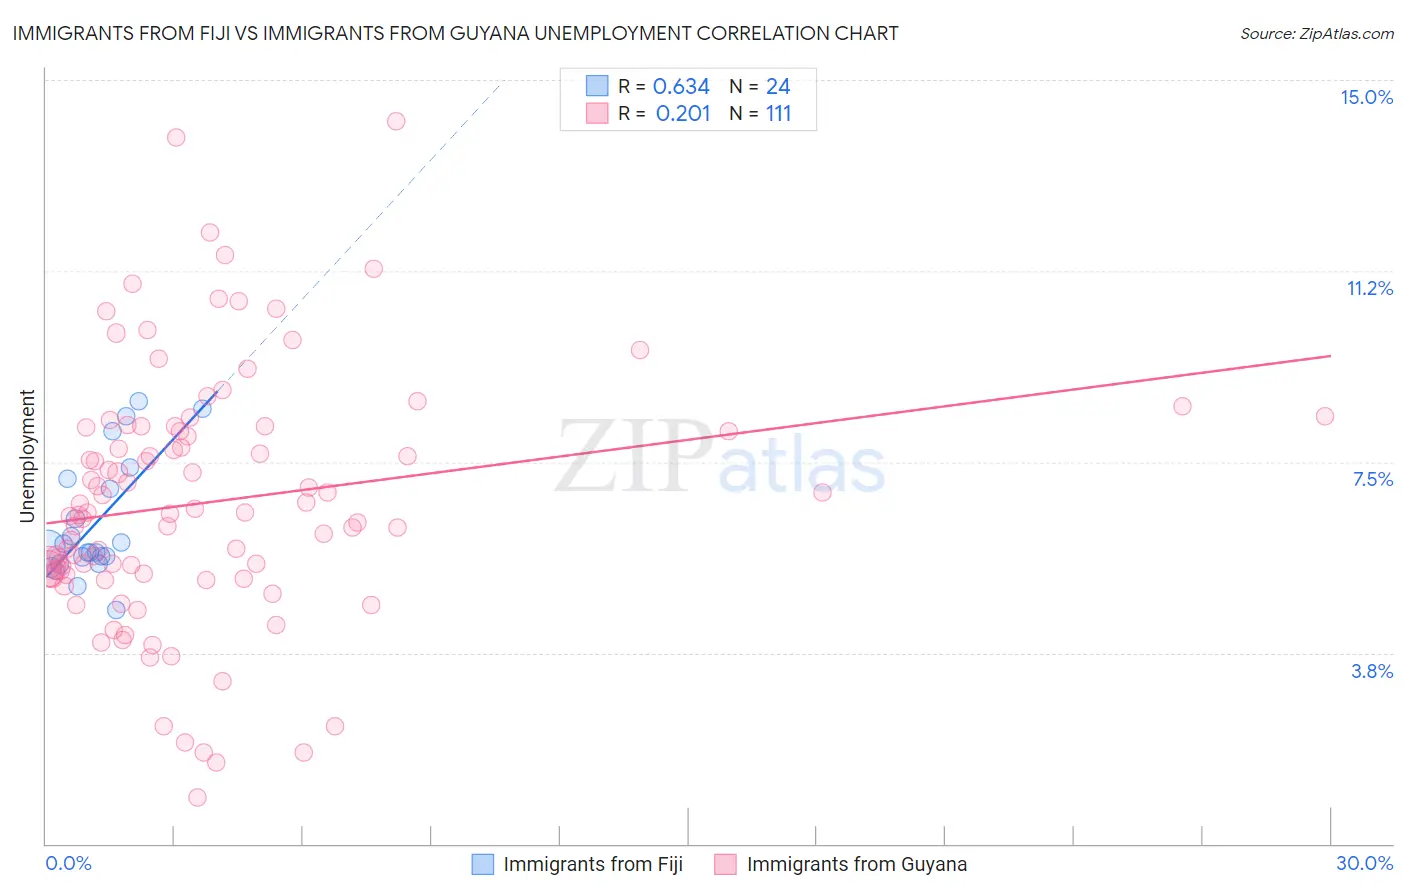
Immigrants from Fiji vs Immigrants from Guyana Unemployment Correlation Chart
The statistical analysis conducted on geographies consisting of 93,754,040 people shows a significant positive correlation between the proportion of Immigrants from Fiji and unemployment in the United States with a correlation coefficient (R) of 0.634 and weighted average of 5.9%. Similarly, the statistical analysis conducted on geographies consisting of 183,677,376 people shows a weak positive correlation between the proportion of Immigrants from Guyana and unemployment in the United States with a correlation coefficient (R) of 0.201 and weighted average of 6.9%, a difference of 16.6%.
Unemployment Correlation Summary
| Measurement | Immigrants from Fiji | Immigrants from Guyana |
| Minimum | 4.6% | 0.90% |
| Maximum | 8.7% | 14.2% |
| Range | 4.1% | 13.3% |
| Mean | 6.3% | 6.7% |
| Median | 5.8% | 6.5% |
| Interquartile 25% (IQ1) | 5.6% | 5.3% |
| Interquartile 75% (IQ3) | 7.1% | 8.2% |
| Interquartile Range (IQR) | 1.5% | 2.9% |
| Standard Deviation (Sample) | 1.2% | 2.5% |
| Standard Deviation (Population) | 1.1% | 2.5% |
Similar Demographics by Unemployment
Demographics Similar to Immigrants from Fiji by Unemployment
In terms of unemployment, the demographic groups most similar to Immigrants from Fiji are Hispanic or Latino (5.9%, a difference of 0.17%), Bahamian (5.9%, a difference of 0.29%), Immigrants from Latin America (5.9%, a difference of 0.50%), Immigrants from Central America (6.0%, a difference of 0.78%), and Mexican (5.9%, a difference of 0.85%).
| Demographics | Rating | Rank | Unemployment |
| Mexican American Indians | 0.1 /100 | #266 | Tragic 5.8% |
| Immigrants | Nigeria | 0.1 /100 | #267 | Tragic 5.8% |
| Immigrants | Sierra Leone | 0.1 /100 | #268 | Tragic 5.8% |
| Immigrants | El Salvador | 0.1 /100 | #269 | Tragic 5.8% |
| Blackfeet | 0.1 /100 | #270 | Tragic 5.8% |
| Mexicans | 0.1 /100 | #271 | Tragic 5.9% |
| Hispanics or Latinos | 0.0 /100 | #272 | Tragic 5.9% |
| Immigrants | Fiji | 0.0 /100 | #273 | Tragic 5.9% |
| Bahamians | 0.0 /100 | #274 | Tragic 5.9% |
| Immigrants | Latin America | 0.0 /100 | #275 | Tragic 5.9% |
| Immigrants | Central America | 0.0 /100 | #276 | Tragic 6.0% |
| Armenians | 0.0 /100 | #277 | Tragic 6.0% |
| Ghanaians | 0.0 /100 | #278 | Tragic 6.0% |
| Immigrants | Mexico | 0.0 /100 | #279 | Tragic 6.0% |
| Immigrants | Western Africa | 0.0 /100 | #280 | Tragic 6.0% |
Demographics Similar to Immigrants from Guyana by Unemployment
In terms of unemployment, the demographic groups most similar to Immigrants from Guyana are Immigrants from St. Vincent and the Grenadines (6.9%, a difference of 0.010%), Guyanese (6.9%, a difference of 0.040%), Immigrants from Grenada (6.9%, a difference of 0.36%), British West Indian (6.8%, a difference of 0.81%), and Immigrants from Cabo Verde (6.8%, a difference of 1.0%).
| Demographics | Rating | Rank | Unemployment |
| Blacks/African Americans | 0.0 /100 | #314 | Tragic 6.6% |
| Houma | 0.0 /100 | #315 | Tragic 6.7% |
| Immigrants | Dominica | 0.0 /100 | #316 | Tragic 6.7% |
| Shoshone | 0.0 /100 | #317 | Tragic 6.8% |
| Immigrants | Cabo Verde | 0.0 /100 | #318 | Tragic 6.8% |
| British West Indians | 0.0 /100 | #319 | Tragic 6.8% |
| Immigrants | St. Vincent and the Grenadines | 0.0 /100 | #320 | Tragic 6.9% |
| Immigrants | Guyana | 0.0 /100 | #321 | Tragic 6.9% |
| Guyanese | 0.0 /100 | #322 | Tragic 6.9% |
| Immigrants | Grenada | 0.0 /100 | #323 | Tragic 6.9% |
| Immigrants | Armenia | 0.0 /100 | #324 | Tragic 7.0% |
| Natives/Alaskans | 0.0 /100 | #325 | Tragic 7.0% |
| Paiute | 0.0 /100 | #326 | Tragic 7.1% |
| Pueblo | 0.0 /100 | #327 | Tragic 7.2% |
| Tsimshian | 0.0 /100 | #328 | Tragic 7.2% |