Immigrants from Fiji vs Mexican American Indian Unemployment
COMPARE
Immigrants from Fiji
Mexican American Indian
Unemployment
Unemployment Comparison
Immigrants from Fiji
Mexican American Indians
5.9%
UNEMPLOYMENT
0.0/ 100
METRIC RATING
273rd/ 347
METRIC RANK
5.8%
UNEMPLOYMENT
0.1/ 100
METRIC RATING
266th/ 347
METRIC RANK
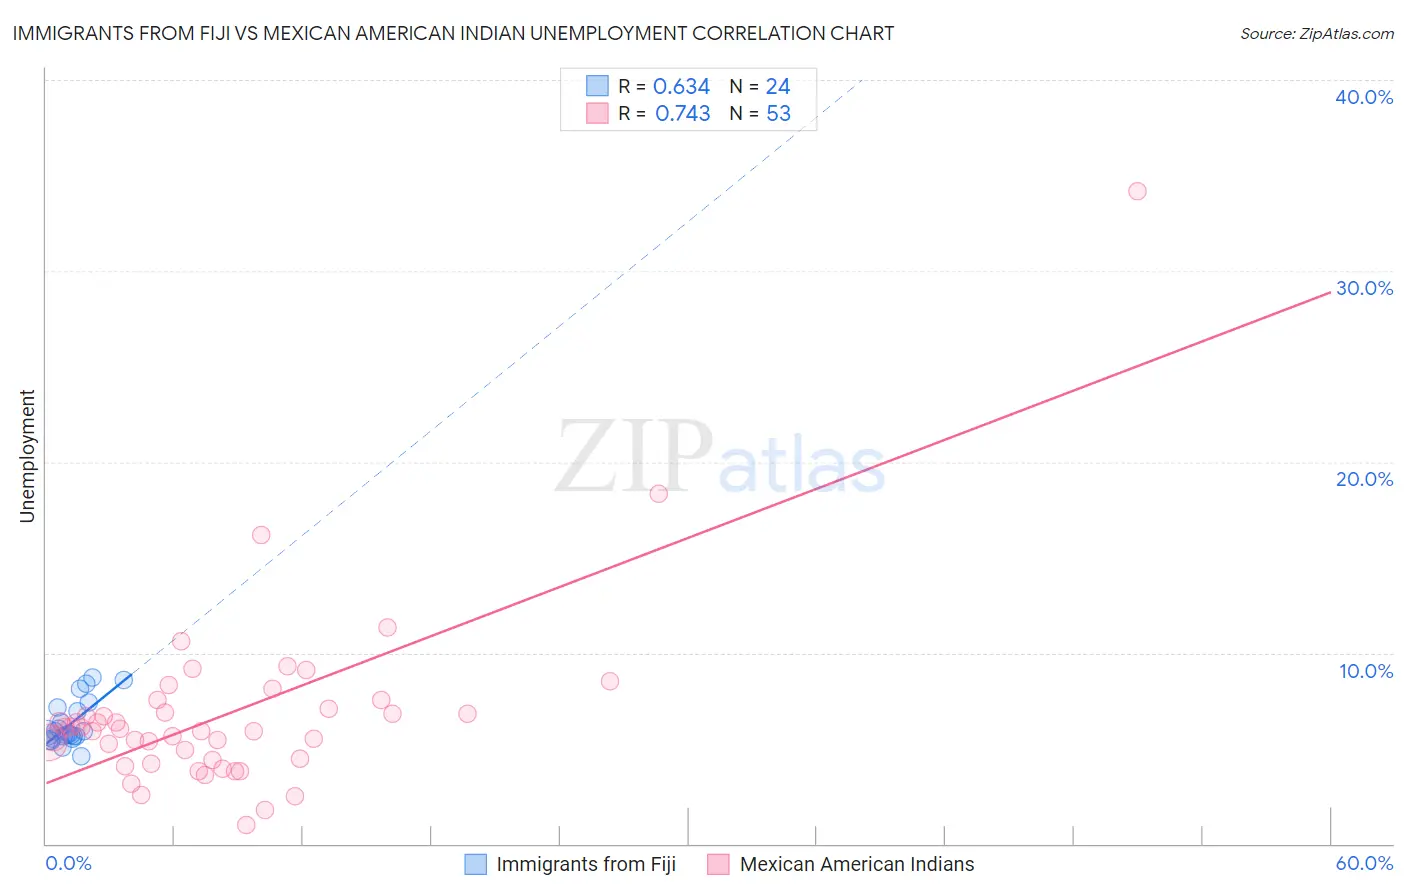
Immigrants from Fiji vs Mexican American Indian Unemployment Correlation Chart
The statistical analysis conducted on geographies consisting of 93,754,040 people shows a significant positive correlation between the proportion of Immigrants from Fiji and unemployment in the United States with a correlation coefficient (R) of 0.634 and weighted average of 5.9%. Similarly, the statistical analysis conducted on geographies consisting of 317,380,306 people shows a strong positive correlation between the proportion of Mexican American Indians and unemployment in the United States with a correlation coefficient (R) of 0.743 and weighted average of 5.8%, a difference of 1.3%.
Unemployment Correlation Summary
| Measurement | Immigrants from Fiji | Mexican American Indian |
| Minimum | 4.6% | 1.0% |
| Maximum | 8.7% | 34.2% |
| Range | 4.1% | 33.2% |
| Mean | 6.3% | 6.8% |
| Median | 5.8% | 6.0% |
| Interquartile 25% (IQ1) | 5.6% | 4.4% |
| Interquartile 75% (IQ3) | 7.1% | 7.3% |
| Interquartile Range (IQR) | 1.5% | 2.9% |
| Standard Deviation (Sample) | 1.2% | 4.9% |
| Standard Deviation (Population) | 1.1% | 4.8% |
Demographics Similar to Immigrants from Fiji and Mexican American Indians by Unemployment
In terms of unemployment, the demographic groups most similar to Immigrants from Fiji are Hispanic or Latino (5.9%, a difference of 0.17%), Bahamian (5.9%, a difference of 0.29%), Immigrants from Latin America (5.9%, a difference of 0.50%), Immigrants from Central America (6.0%, a difference of 0.78%), and Mexican (5.9%, a difference of 0.85%). Similarly, the demographic groups most similar to Mexican American Indians are Immigrants from Nigeria (5.8%, a difference of 0.070%), Immigrants from Sierra Leone (5.8%, a difference of 0.11%), Immigrants from El Salvador (5.8%, a difference of 0.12%), Blackfeet (5.8%, a difference of 0.20%), and Nigerian (5.8%, a difference of 0.40%).
| Demographics | Rating | Rank | Unemployment |
| Sub-Saharan Africans | 0.1 /100 | #259 | Tragic 5.8% |
| Immigrants | Uzbekistan | 0.1 /100 | #260 | Tragic 5.8% |
| Immigrants | Guatemala | 0.1 /100 | #261 | Tragic 5.8% |
| Sierra Leoneans | 0.1 /100 | #262 | Tragic 5.8% |
| Salvadorans | 0.1 /100 | #263 | Tragic 5.8% |
| Immigrants | Liberia | 0.1 /100 | #264 | Tragic 5.8% |
| Nigerians | 0.1 /100 | #265 | Tragic 5.8% |
| Mexican American Indians | 0.1 /100 | #266 | Tragic 5.8% |
| Immigrants | Nigeria | 0.1 /100 | #267 | Tragic 5.8% |
| Immigrants | Sierra Leone | 0.1 /100 | #268 | Tragic 5.8% |
| Immigrants | El Salvador | 0.1 /100 | #269 | Tragic 5.8% |
| Blackfeet | 0.1 /100 | #270 | Tragic 5.8% |
| Mexicans | 0.1 /100 | #271 | Tragic 5.9% |
| Hispanics or Latinos | 0.0 /100 | #272 | Tragic 5.9% |
| Immigrants | Fiji | 0.0 /100 | #273 | Tragic 5.9% |
| Bahamians | 0.0 /100 | #274 | Tragic 5.9% |
| Immigrants | Latin America | 0.0 /100 | #275 | Tragic 5.9% |
| Immigrants | Central America | 0.0 /100 | #276 | Tragic 6.0% |
| Armenians | 0.0 /100 | #277 | Tragic 6.0% |
| Ghanaians | 0.0 /100 | #278 | Tragic 6.0% |
| Immigrants | Mexico | 0.0 /100 | #279 | Tragic 6.0% |