Immigrants from Fiji vs Immigrants from Guyana 1st Grade
COMPARE
Immigrants from Fiji
Immigrants from Guyana
1st Grade
1st Grade Comparison
Immigrants from Fiji
Immigrants from Guyana
96.4%
1ST GRADE
0.0/ 100
METRIC RATING
338th/ 347
METRIC RANK
96.8%
1ST GRADE
0.0/ 100
METRIC RATING
319th/ 347
METRIC RANK
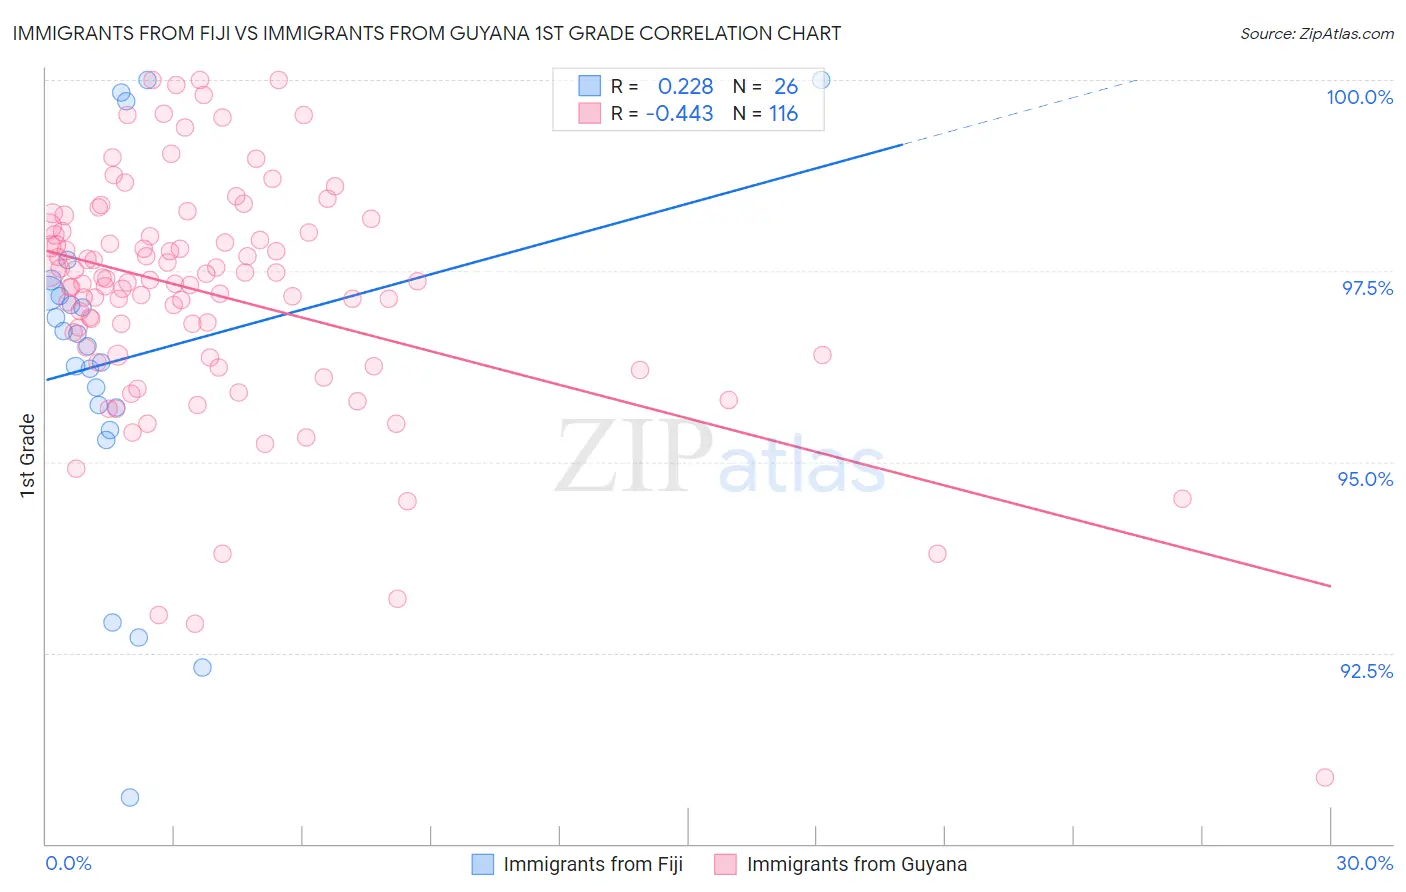
Immigrants from Fiji vs Immigrants from Guyana 1st Grade Correlation Chart
The statistical analysis conducted on geographies consisting of 93,756,204 people shows a weak positive correlation between the proportion of Immigrants from Fiji and percentage of population with at least 1st grade education in the United States with a correlation coefficient (R) of 0.228 and weighted average of 96.4%. Similarly, the statistical analysis conducted on geographies consisting of 183,746,342 people shows a moderate negative correlation between the proportion of Immigrants from Guyana and percentage of population with at least 1st grade education in the United States with a correlation coefficient (R) of -0.443 and weighted average of 96.8%, a difference of 0.38%.
1st Grade Correlation Summary
| Measurement | Immigrants from Fiji | Immigrants from Guyana |
| Minimum | 90.6% | 90.9% |
| Maximum | 100.0% | 100.0% |
| Range | 9.4% | 9.1% |
| Mean | 96.4% | 97.2% |
| Median | 96.6% | 97.4% |
| Interquartile 25% (IQ1) | 95.7% | 96.4% |
| Interquartile 75% (IQ3) | 97.2% | 98.0% |
| Interquartile Range (IQR) | 1.5% | 1.6% |
| Standard Deviation (Sample) | 2.3% | 1.6% |
| Standard Deviation (Population) | 2.3% | 1.6% |
Demographics Similar to Immigrants from Fiji and Immigrants from Guyana by 1st Grade
In terms of 1st grade, the demographic groups most similar to Immigrants from Fiji are Immigrants from Cambodia (96.5%, a difference of 0.020%), Guatemalan (96.5%, a difference of 0.050%), Yakama (96.5%, a difference of 0.080%), Immigrants from Dominican Republic (96.5%, a difference of 0.10%), and Bangladeshi (96.5%, a difference of 0.10%). Similarly, the demographic groups most similar to Immigrants from Guyana are Immigrants from Burma/Myanmar (96.8%, a difference of 0.0%), Immigrants from Laos (96.8%, a difference of 0.010%), Immigrants from Bangladesh (96.8%, a difference of 0.010%), Mexican American Indian (96.8%, a difference of 0.030%), and Immigrants from Honduras (96.8%, a difference of 0.030%).
| Demographics | Rating | Rank | 1st Grade |
| Immigrants | Laos | 0.0 /100 | #318 | Tragic 96.8% |
| Immigrants | Guyana | 0.0 /100 | #319 | Tragic 96.8% |
| Immigrants | Burma/Myanmar | 0.0 /100 | #320 | Tragic 96.8% |
| Immigrants | Bangladesh | 0.0 /100 | #321 | Tragic 96.8% |
| Mexican American Indians | 0.0 /100 | #322 | Tragic 96.8% |
| Immigrants | Honduras | 0.0 /100 | #323 | Tragic 96.8% |
| Vietnamese | 0.0 /100 | #324 | Tragic 96.8% |
| Dominicans | 0.0 /100 | #325 | Tragic 96.7% |
| Indonesians | 0.0 /100 | #326 | Tragic 96.7% |
| Mexicans | 0.0 /100 | #327 | Tragic 96.7% |
| Immigrants | Latin America | 0.0 /100 | #328 | Tragic 96.7% |
| Japanese | 0.0 /100 | #329 | Tragic 96.6% |
| Immigrants | Vietnam | 0.0 /100 | #330 | Tragic 96.6% |
| Immigrants | Armenia | 0.0 /100 | #331 | Tragic 96.6% |
| Central Americans | 0.0 /100 | #332 | Tragic 96.5% |
| Immigrants | Dominican Republic | 0.0 /100 | #333 | Tragic 96.5% |
| Bangladeshis | 0.0 /100 | #334 | Tragic 96.5% |
| Yakama | 0.0 /100 | #335 | Tragic 96.5% |
| Guatemalans | 0.0 /100 | #336 | Tragic 96.5% |
| Immigrants | Cambodia | 0.0 /100 | #337 | Tragic 96.5% |
| Immigrants | Fiji | 0.0 /100 | #338 | Tragic 96.4% |