Immigrants from Indonesia vs Immigrants from Guyana Unemployment
COMPARE
Immigrants from Indonesia
Immigrants from Guyana
Unemployment
Unemployment Comparison
Immigrants from Indonesia
Immigrants from Guyana
5.2%
UNEMPLOYMENT
61.2/ 100
METRIC RATING
166th/ 347
METRIC RANK
6.9%
UNEMPLOYMENT
0.0/ 100
METRIC RATING
321st/ 347
METRIC RANK
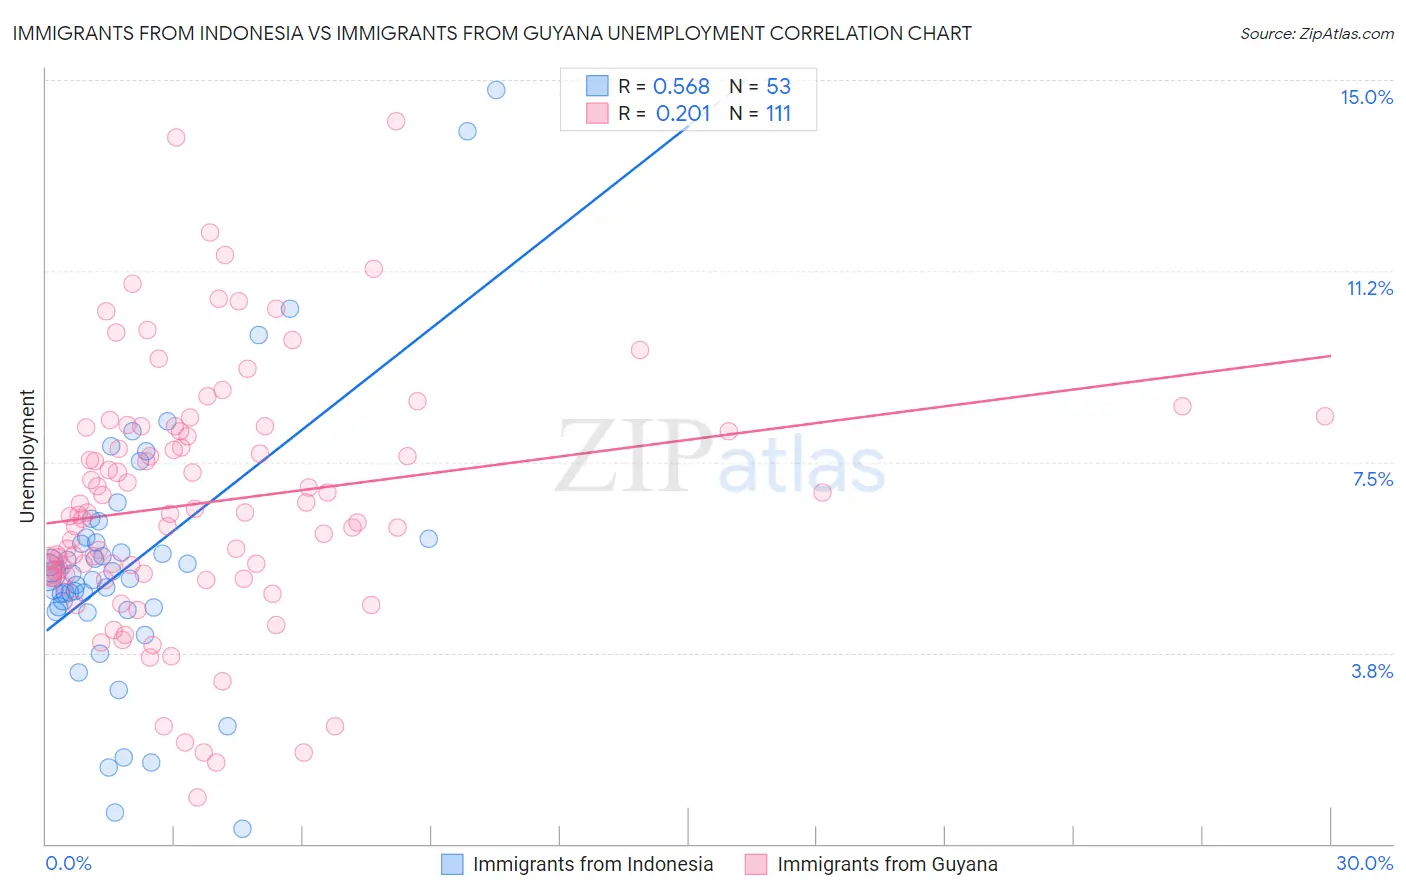
Immigrants from Indonesia vs Immigrants from Guyana Unemployment Correlation Chart
The statistical analysis conducted on geographies consisting of 215,714,368 people shows a substantial positive correlation between the proportion of Immigrants from Indonesia and unemployment in the United States with a correlation coefficient (R) of 0.568 and weighted average of 5.2%. Similarly, the statistical analysis conducted on geographies consisting of 183,677,376 people shows a weak positive correlation between the proportion of Immigrants from Guyana and unemployment in the United States with a correlation coefficient (R) of 0.201 and weighted average of 6.9%, a difference of 32.0%.
Unemployment Correlation Summary
| Measurement | Immigrants from Indonesia | Immigrants from Guyana |
| Minimum | 0.30% | 0.90% |
| Maximum | 14.8% | 14.2% |
| Range | 14.5% | 13.3% |
| Mean | 5.5% | 6.7% |
| Median | 5.3% | 6.5% |
| Interquartile 25% (IQ1) | 4.6% | 5.3% |
| Interquartile 75% (IQ3) | 6.0% | 8.2% |
| Interquartile Range (IQR) | 1.4% | 2.9% |
| Standard Deviation (Sample) | 2.7% | 2.5% |
| Standard Deviation (Population) | 2.6% | 2.5% |
Similar Demographics by Unemployment
Demographics Similar to Immigrants from Indonesia by Unemployment
In terms of unemployment, the demographic groups most similar to Immigrants from Indonesia are Colombian (5.2%, a difference of 0.010%), Uruguayan (5.2%, a difference of 0.060%), Immigrants from Brazil (5.2%, a difference of 0.13%), Immigrants from Morocco (5.2%, a difference of 0.14%), and Immigrants from Zaire (5.2%, a difference of 0.23%).
| Demographics | Rating | Rank | Unemployment |
| Immigrants | Russia | 66.6 /100 | #159 | Good 5.2% |
| Laotians | 66.3 /100 | #160 | Good 5.2% |
| Immigrants | Oceania | 65.2 /100 | #161 | Good 5.2% |
| Spanish | 65.1 /100 | #162 | Good 5.2% |
| Immigrants | Zaire | 64.7 /100 | #163 | Good 5.2% |
| Immigrants | Colombia | 64.7 /100 | #164 | Good 5.2% |
| Immigrants | Brazil | 63.1 /100 | #165 | Good 5.2% |
| Immigrants | Indonesia | 61.2 /100 | #166 | Good 5.2% |
| Colombians | 61.1 /100 | #167 | Good 5.2% |
| Uruguayans | 60.2 /100 | #168 | Good 5.2% |
| Immigrants | Morocco | 59.1 /100 | #169 | Average 5.2% |
| Immigrants | Nicaragua | 57.1 /100 | #170 | Average 5.2% |
| Puget Sound Salish | 56.6 /100 | #171 | Average 5.2% |
| Immigrants | Vietnam | 52.5 /100 | #172 | Average 5.2% |
| Immigrants | Poland | 51.8 /100 | #173 | Average 5.3% |
Demographics Similar to Immigrants from Guyana by Unemployment
In terms of unemployment, the demographic groups most similar to Immigrants from Guyana are Immigrants from St. Vincent and the Grenadines (6.9%, a difference of 0.010%), Guyanese (6.9%, a difference of 0.040%), Immigrants from Grenada (6.9%, a difference of 0.36%), British West Indian (6.8%, a difference of 0.81%), and Immigrants from Cabo Verde (6.8%, a difference of 1.0%).
| Demographics | Rating | Rank | Unemployment |
| Blacks/African Americans | 0.0 /100 | #314 | Tragic 6.6% |
| Houma | 0.0 /100 | #315 | Tragic 6.7% |
| Immigrants | Dominica | 0.0 /100 | #316 | Tragic 6.7% |
| Shoshone | 0.0 /100 | #317 | Tragic 6.8% |
| Immigrants | Cabo Verde | 0.0 /100 | #318 | Tragic 6.8% |
| British West Indians | 0.0 /100 | #319 | Tragic 6.8% |
| Immigrants | St. Vincent and the Grenadines | 0.0 /100 | #320 | Tragic 6.9% |
| Immigrants | Guyana | 0.0 /100 | #321 | Tragic 6.9% |
| Guyanese | 0.0 /100 | #322 | Tragic 6.9% |
| Immigrants | Grenada | 0.0 /100 | #323 | Tragic 6.9% |
| Immigrants | Armenia | 0.0 /100 | #324 | Tragic 7.0% |
| Natives/Alaskans | 0.0 /100 | #325 | Tragic 7.0% |
| Paiute | 0.0 /100 | #326 | Tragic 7.1% |
| Pueblo | 0.0 /100 | #327 | Tragic 7.2% |
| Tsimshian | 0.0 /100 | #328 | Tragic 7.2% |