Bolivian vs Native/Alaskan Male Unemployment
COMPARE
Bolivian
Native/Alaskan
Male Unemployment
Male Unemployment Comparison
Bolivians
Natives/Alaskans
4.7%
MALE UNEMPLOYMENT
100.0/ 100
METRIC RATING
13th/ 347
METRIC RANK
7.7%
MALE UNEMPLOYMENT
0.0/ 100
METRIC RATING
328th/ 347
METRIC RANK
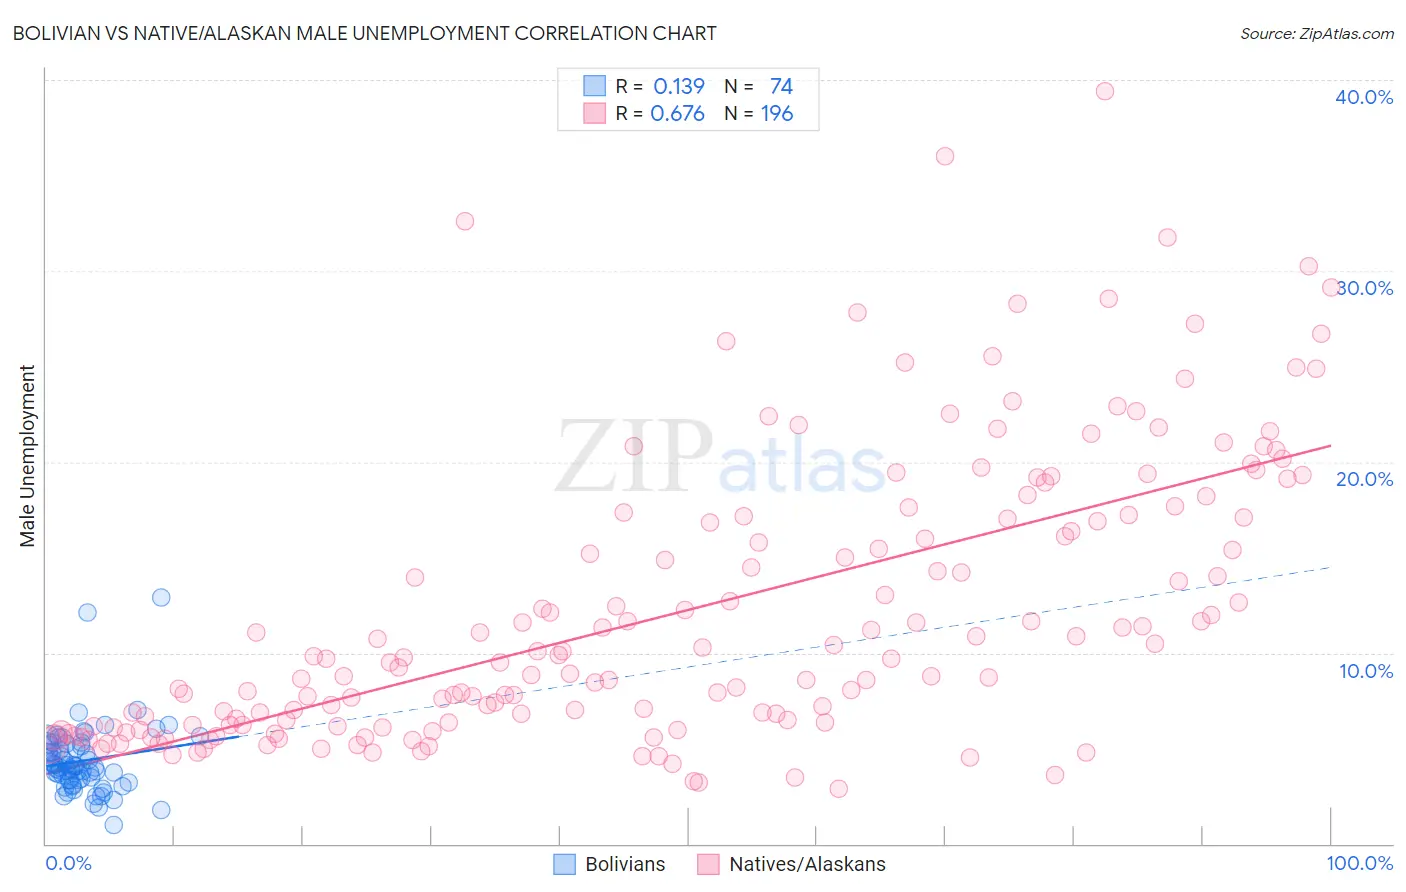
Bolivian vs Native/Alaskan Male Unemployment Correlation Chart
The statistical analysis conducted on geographies consisting of 184,402,671 people shows a poor positive correlation between the proportion of Bolivians and unemployment rate among males in the United States with a correlation coefficient (R) of 0.139 and weighted average of 4.7%. Similarly, the statistical analysis conducted on geographies consisting of 507,569,897 people shows a significant positive correlation between the proportion of Natives/Alaskans and unemployment rate among males in the United States with a correlation coefficient (R) of 0.676 and weighted average of 7.7%, a difference of 64.5%.
Male Unemployment Correlation Summary
| Measurement | Bolivian | Native/Alaskan |
| Minimum | 1.0% | 2.9% |
| Maximum | 12.9% | 39.4% |
| Range | 11.9% | 36.5% |
| Mean | 4.3% | 12.2% |
| Median | 4.0% | 9.7% |
| Interquartile 25% (IQ1) | 3.4% | 6.2% |
| Interquartile 75% (IQ3) | 5.2% | 17.1% |
| Interquartile Range (IQR) | 1.8% | 10.9% |
| Standard Deviation (Sample) | 1.8% | 7.4% |
| Standard Deviation (Population) | 1.8% | 7.4% |
Similar Demographics by Male Unemployment
Demographics Similar to Bolivians by Male Unemployment
In terms of male unemployment, the demographic groups most similar to Bolivians are German (4.7%, a difference of 0.020%), Scandinavian (4.7%, a difference of 0.29%), Swiss (4.7%, a difference of 0.34%), Immigrants from Bolivia (4.7%, a difference of 0.68%), and Filipino (4.7%, a difference of 1.1%).
| Demographics | Rating | Rank | Male Unemployment |
| Venezuelans | 100.0 /100 | #6 | Exceptional 4.5% |
| Czechs | 100.0 /100 | #7 | Exceptional 4.5% |
| Luxembourgers | 100.0 /100 | #8 | Exceptional 4.5% |
| Thais | 100.0 /100 | #9 | Exceptional 4.6% |
| Cubans | 100.0 /100 | #10 | Exceptional 4.6% |
| Swedes | 100.0 /100 | #11 | Exceptional 4.6% |
| Immigrants | Bolivia | 100.0 /100 | #12 | Exceptional 4.7% |
| Bolivians | 100.0 /100 | #13 | Exceptional 4.7% |
| Germans | 100.0 /100 | #14 | Exceptional 4.7% |
| Scandinavians | 100.0 /100 | #15 | Exceptional 4.7% |
| Swiss | 99.9 /100 | #16 | Exceptional 4.7% |
| Filipinos | 99.9 /100 | #17 | Exceptional 4.7% |
| English | 99.9 /100 | #18 | Exceptional 4.8% |
| Europeans | 99.9 /100 | #19 | Exceptional 4.8% |
| Pennsylvania Germans | 99.9 /100 | #20 | Exceptional 4.8% |
Demographics Similar to Natives/Alaskans by Male Unemployment
In terms of male unemployment, the demographic groups most similar to Natives/Alaskans are Paiute (7.7%, a difference of 0.38%), Immigrants from Yemen (7.8%, a difference of 0.90%), Immigrants from Dominican Republic (7.6%, a difference of 1.5%), Shoshone (7.6%, a difference of 1.6%), and Dominican (7.6%, a difference of 2.0%).
| Demographics | Rating | Rank | Male Unemployment |
| Immigrants | St. Vincent and the Grenadines | 0.0 /100 | #321 | Tragic 7.5% |
| Immigrants | Cabo Verde | 0.0 /100 | #322 | Tragic 7.5% |
| Immigrants | Grenada | 0.0 /100 | #323 | Tragic 7.6% |
| Dominicans | 0.0 /100 | #324 | Tragic 7.6% |
| Shoshone | 0.0 /100 | #325 | Tragic 7.6% |
| Immigrants | Dominican Republic | 0.0 /100 | #326 | Tragic 7.6% |
| Paiute | 0.0 /100 | #327 | Tragic 7.7% |
| Natives/Alaskans | 0.0 /100 | #328 | Tragic 7.7% |
| Immigrants | Yemen | 0.0 /100 | #329 | Tragic 7.8% |
| Yakama | 0.0 /100 | #330 | Tragic 7.9% |
| Alaska Natives | 0.0 /100 | #331 | Tragic 8.1% |
| Pima | 0.0 /100 | #332 | Tragic 8.3% |
| Sioux | 0.0 /100 | #333 | Tragic 8.4% |
| Tsimshian | 0.0 /100 | #334 | Tragic 8.5% |
| Pueblo | 0.0 /100 | #335 | Tragic 8.5% |