Immigrants from Singapore vs Native/Alaskan Male Unemployment
COMPARE
Immigrants from Singapore
Native/Alaskan
Male Unemployment
Male Unemployment Comparison
Immigrants from Singapore
Natives/Alaskans
4.9%
MALE UNEMPLOYMENT
99.4/ 100
METRIC RATING
36th/ 347
METRIC RANK
7.7%
MALE UNEMPLOYMENT
0.0/ 100
METRIC RATING
328th/ 347
METRIC RANK
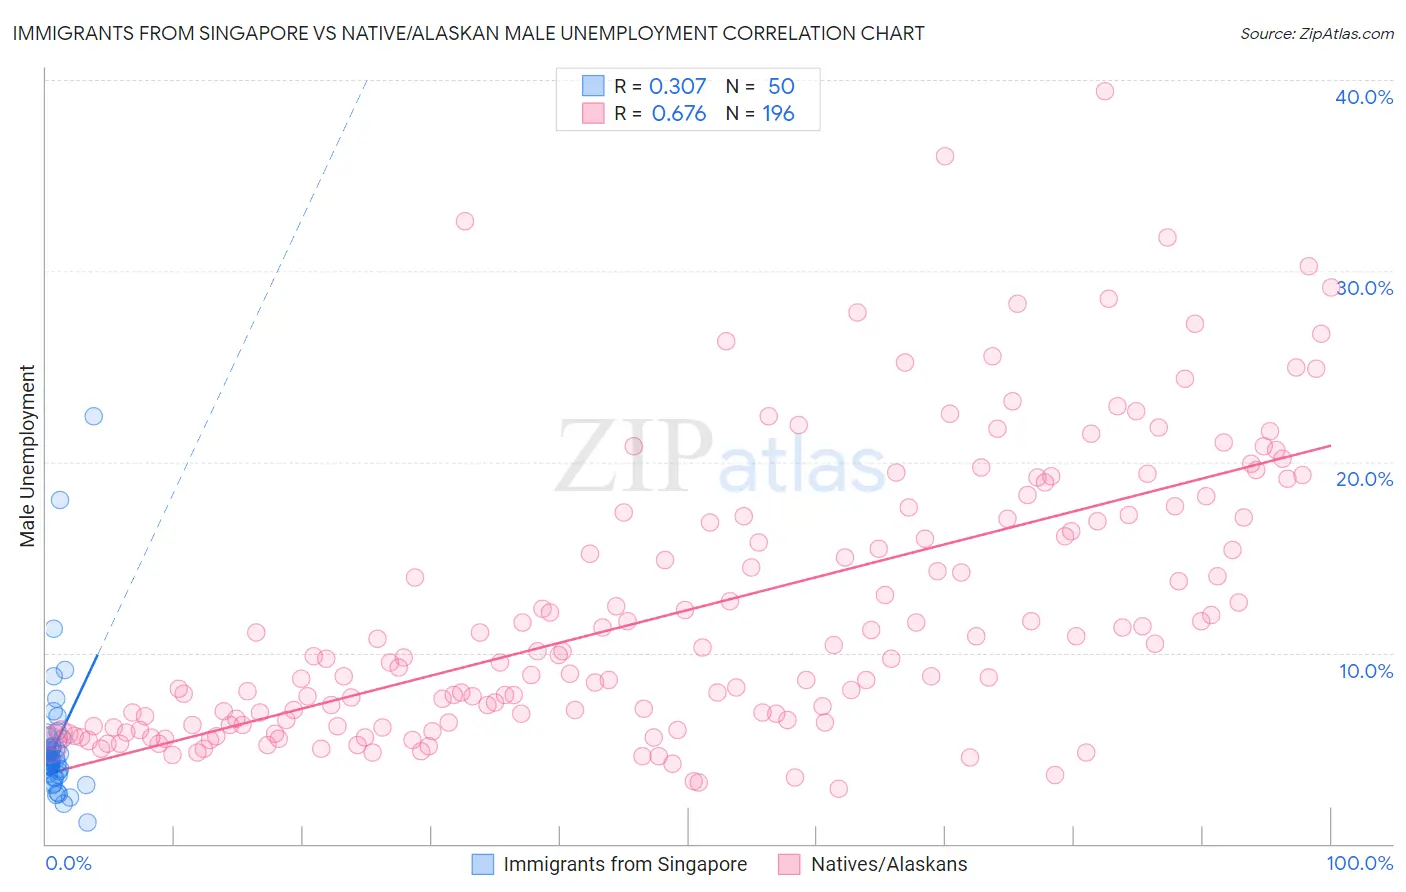
Immigrants from Singapore vs Native/Alaskan Male Unemployment Correlation Chart
The statistical analysis conducted on geographies consisting of 137,392,215 people shows a mild positive correlation between the proportion of Immigrants from Singapore and unemployment rate among males in the United States with a correlation coefficient (R) of 0.307 and weighted average of 4.9%. Similarly, the statistical analysis conducted on geographies consisting of 507,569,897 people shows a significant positive correlation between the proportion of Natives/Alaskans and unemployment rate among males in the United States with a correlation coefficient (R) of 0.676 and weighted average of 7.7%, a difference of 57.7%.
Male Unemployment Correlation Summary
| Measurement | Immigrants from Singapore | Native/Alaskan |
| Minimum | 1.1% | 2.9% |
| Maximum | 22.4% | 39.4% |
| Range | 21.3% | 36.5% |
| Mean | 5.3% | 12.2% |
| Median | 4.4% | 9.7% |
| Interquartile 25% (IQ1) | 3.6% | 6.2% |
| Interquartile 75% (IQ3) | 5.1% | 17.1% |
| Interquartile Range (IQR) | 1.4% | 10.9% |
| Standard Deviation (Sample) | 3.6% | 7.4% |
| Standard Deviation (Population) | 3.6% | 7.4% |
Similar Demographics by Male Unemployment
Demographics Similar to Immigrants from Singapore by Male Unemployment
In terms of male unemployment, the demographic groups most similar to Immigrants from Singapore are Paraguayan (4.9%, a difference of 0.080%), Scotch-Irish (4.9%, a difference of 0.21%), Immigrants from Bosnia and Herzegovina (4.9%, a difference of 0.23%), Burmese (4.9%, a difference of 0.30%), and Northern European (4.9%, a difference of 0.38%).
| Demographics | Rating | Rank | Male Unemployment |
| Scottish | 99.8 /100 | #29 | Exceptional 4.8% |
| British | 99.8 /100 | #30 | Exceptional 4.8% |
| Sudanese | 99.8 /100 | #31 | Exceptional 4.8% |
| Immigrants | Nepal | 99.8 /100 | #32 | Exceptional 4.8% |
| Latvians | 99.7 /100 | #33 | Exceptional 4.8% |
| Welsh | 99.7 /100 | #34 | Exceptional 4.8% |
| Paraguayans | 99.5 /100 | #35 | Exceptional 4.9% |
| Immigrants | Singapore | 99.4 /100 | #36 | Exceptional 4.9% |
| Scotch-Irish | 99.4 /100 | #37 | Exceptional 4.9% |
| Immigrants | Bosnia and Herzegovina | 99.4 /100 | #38 | Exceptional 4.9% |
| Burmese | 99.3 /100 | #39 | Exceptional 4.9% |
| Northern Europeans | 99.3 /100 | #40 | Exceptional 4.9% |
| Chinese | 99.3 /100 | #41 | Exceptional 4.9% |
| Immigrants | Belgium | 99.2 /100 | #42 | Exceptional 4.9% |
| Immigrants | Japan | 99.2 /100 | #43 | Exceptional 4.9% |
Demographics Similar to Natives/Alaskans by Male Unemployment
In terms of male unemployment, the demographic groups most similar to Natives/Alaskans are Paiute (7.7%, a difference of 0.38%), Immigrants from Yemen (7.8%, a difference of 0.90%), Immigrants from Dominican Republic (7.6%, a difference of 1.5%), Shoshone (7.6%, a difference of 1.6%), and Dominican (7.6%, a difference of 2.0%).
| Demographics | Rating | Rank | Male Unemployment |
| Immigrants | St. Vincent and the Grenadines | 0.0 /100 | #321 | Tragic 7.5% |
| Immigrants | Cabo Verde | 0.0 /100 | #322 | Tragic 7.5% |
| Immigrants | Grenada | 0.0 /100 | #323 | Tragic 7.6% |
| Dominicans | 0.0 /100 | #324 | Tragic 7.6% |
| Shoshone | 0.0 /100 | #325 | Tragic 7.6% |
| Immigrants | Dominican Republic | 0.0 /100 | #326 | Tragic 7.6% |
| Paiute | 0.0 /100 | #327 | Tragic 7.7% |
| Natives/Alaskans | 0.0 /100 | #328 | Tragic 7.7% |
| Immigrants | Yemen | 0.0 /100 | #329 | Tragic 7.8% |
| Yakama | 0.0 /100 | #330 | Tragic 7.9% |
| Alaska Natives | 0.0 /100 | #331 | Tragic 8.1% |
| Pima | 0.0 /100 | #332 | Tragic 8.3% |
| Sioux | 0.0 /100 | #333 | Tragic 8.4% |
| Tsimshian | 0.0 /100 | #334 | Tragic 8.5% |
| Pueblo | 0.0 /100 | #335 | Tragic 8.5% |