Immigrants from North America vs Native/Alaskan Male Unemployment
COMPARE
Immigrants from North America
Native/Alaskan
Male Unemployment
Male Unemployment Comparison
Immigrants from North America
Natives/Alaskans
5.0%
MALE UNEMPLOYMENT
96.9/ 100
METRIC RATING
74th/ 347
METRIC RANK
7.7%
MALE UNEMPLOYMENT
0.0/ 100
METRIC RATING
328th/ 347
METRIC RANK
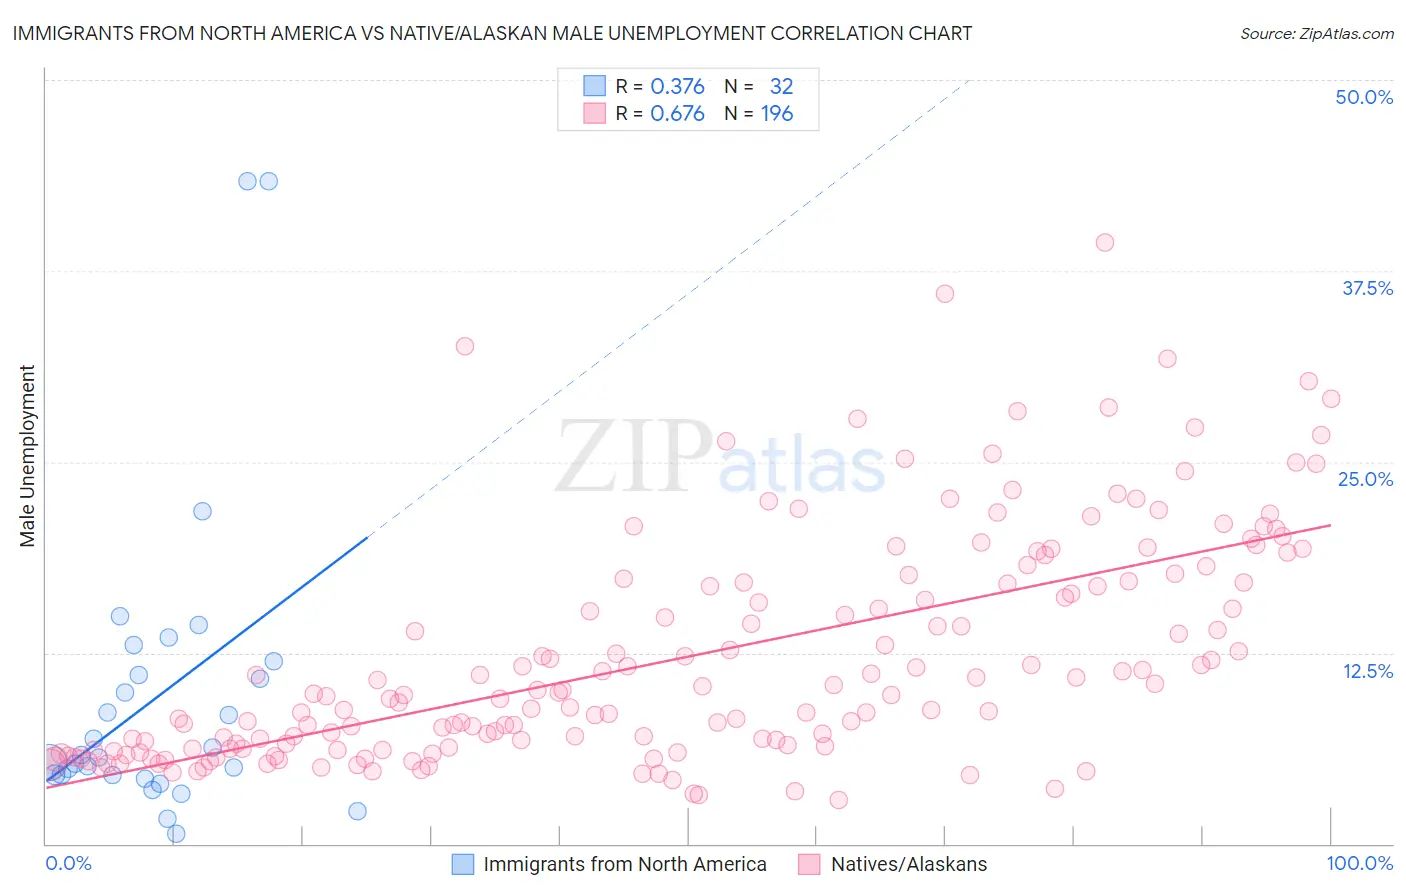
Immigrants from North America vs Native/Alaskan Male Unemployment Correlation Chart
The statistical analysis conducted on geographies consisting of 459,389,542 people shows a mild positive correlation between the proportion of Immigrants from North America and unemployment rate among males in the United States with a correlation coefficient (R) of 0.376 and weighted average of 5.0%. Similarly, the statistical analysis conducted on geographies consisting of 507,569,897 people shows a significant positive correlation between the proportion of Natives/Alaskans and unemployment rate among males in the United States with a correlation coefficient (R) of 0.676 and weighted average of 7.7%, a difference of 53.5%.
Male Unemployment Correlation Summary
| Measurement | Immigrants from North America | Native/Alaskan |
| Minimum | 0.66% | 2.9% |
| Maximum | 43.4% | 39.4% |
| Range | 42.7% | 36.5% |
| Mean | 9.6% | 12.2% |
| Median | 5.8% | 9.7% |
| Interquartile 25% (IQ1) | 4.5% | 6.2% |
| Interquartile 75% (IQ3) | 11.5% | 17.1% |
| Interquartile Range (IQR) | 7.0% | 10.9% |
| Standard Deviation (Sample) | 10.0% | 7.4% |
| Standard Deviation (Population) | 9.8% | 7.4% |
Similar Demographics by Male Unemployment
Demographics Similar to Immigrants from North America by Male Unemployment
In terms of male unemployment, the demographic groups most similar to Immigrants from North America are Greek (5.0%, a difference of 0.030%), Assyrian/Chaldean/Syriac (5.0%, a difference of 0.030%), Immigrants from South Africa (5.0%, a difference of 0.11%), New Zealander (5.0%, a difference of 0.19%), and Immigrants from Sudan (5.0%, a difference of 0.19%).
| Demographics | Rating | Rank | Male Unemployment |
| Immigrants | Canada | 97.5 /100 | #67 | Exceptional 5.0% |
| Australians | 97.4 /100 | #68 | Exceptional 5.0% |
| Immigrants | Sweden | 97.4 /100 | #69 | Exceptional 5.0% |
| Whites/Caucasians | 97.3 /100 | #70 | Exceptional 5.0% |
| New Zealanders | 97.3 /100 | #71 | Exceptional 5.0% |
| Immigrants | South Africa | 97.1 /100 | #72 | Exceptional 5.0% |
| Greeks | 97.0 /100 | #73 | Exceptional 5.0% |
| Immigrants | North America | 96.9 /100 | #74 | Exceptional 5.0% |
| Assyrians/Chaldeans/Syriacs | 96.9 /100 | #75 | Exceptional 5.0% |
| Immigrants | Sudan | 96.5 /100 | #76 | Exceptional 5.0% |
| Iranians | 96.4 /100 | #77 | Exceptional 5.0% |
| Immigrants | Northern Europe | 96.4 /100 | #78 | Exceptional 5.0% |
| South Africans | 96.4 /100 | #79 | Exceptional 5.0% |
| Argentineans | 96.2 /100 | #80 | Exceptional 5.0% |
| French | 96.2 /100 | #81 | Exceptional 5.0% |
Demographics Similar to Natives/Alaskans by Male Unemployment
In terms of male unemployment, the demographic groups most similar to Natives/Alaskans are Paiute (7.7%, a difference of 0.38%), Immigrants from Yemen (7.8%, a difference of 0.90%), Immigrants from Dominican Republic (7.6%, a difference of 1.5%), Shoshone (7.6%, a difference of 1.6%), and Dominican (7.6%, a difference of 2.0%).
| Demographics | Rating | Rank | Male Unemployment |
| Immigrants | St. Vincent and the Grenadines | 0.0 /100 | #321 | Tragic 7.5% |
| Immigrants | Cabo Verde | 0.0 /100 | #322 | Tragic 7.5% |
| Immigrants | Grenada | 0.0 /100 | #323 | Tragic 7.6% |
| Dominicans | 0.0 /100 | #324 | Tragic 7.6% |
| Shoshone | 0.0 /100 | #325 | Tragic 7.6% |
| Immigrants | Dominican Republic | 0.0 /100 | #326 | Tragic 7.6% |
| Paiute | 0.0 /100 | #327 | Tragic 7.7% |
| Natives/Alaskans | 0.0 /100 | #328 | Tragic 7.7% |
| Immigrants | Yemen | 0.0 /100 | #329 | Tragic 7.8% |
| Yakama | 0.0 /100 | #330 | Tragic 7.9% |
| Alaska Natives | 0.0 /100 | #331 | Tragic 8.1% |
| Pima | 0.0 /100 | #332 | Tragic 8.3% |
| Sioux | 0.0 /100 | #333 | Tragic 8.4% |
| Tsimshian | 0.0 /100 | #334 | Tragic 8.5% |
| Pueblo | 0.0 /100 | #335 | Tragic 8.5% |