Fijian vs Immigrants from Philippines Male Unemployment
COMPARE
Fijian
Immigrants from Philippines
Male Unemployment
Male Unemployment Comparison
Fijians
Immigrants from Philippines
5.2%
MALE UNEMPLOYMENT
78.3/ 100
METRIC RATING
142nd/ 347
METRIC RANK
5.4%
MALE UNEMPLOYMENT
13.5/ 100
METRIC RATING
201st/ 347
METRIC RANK
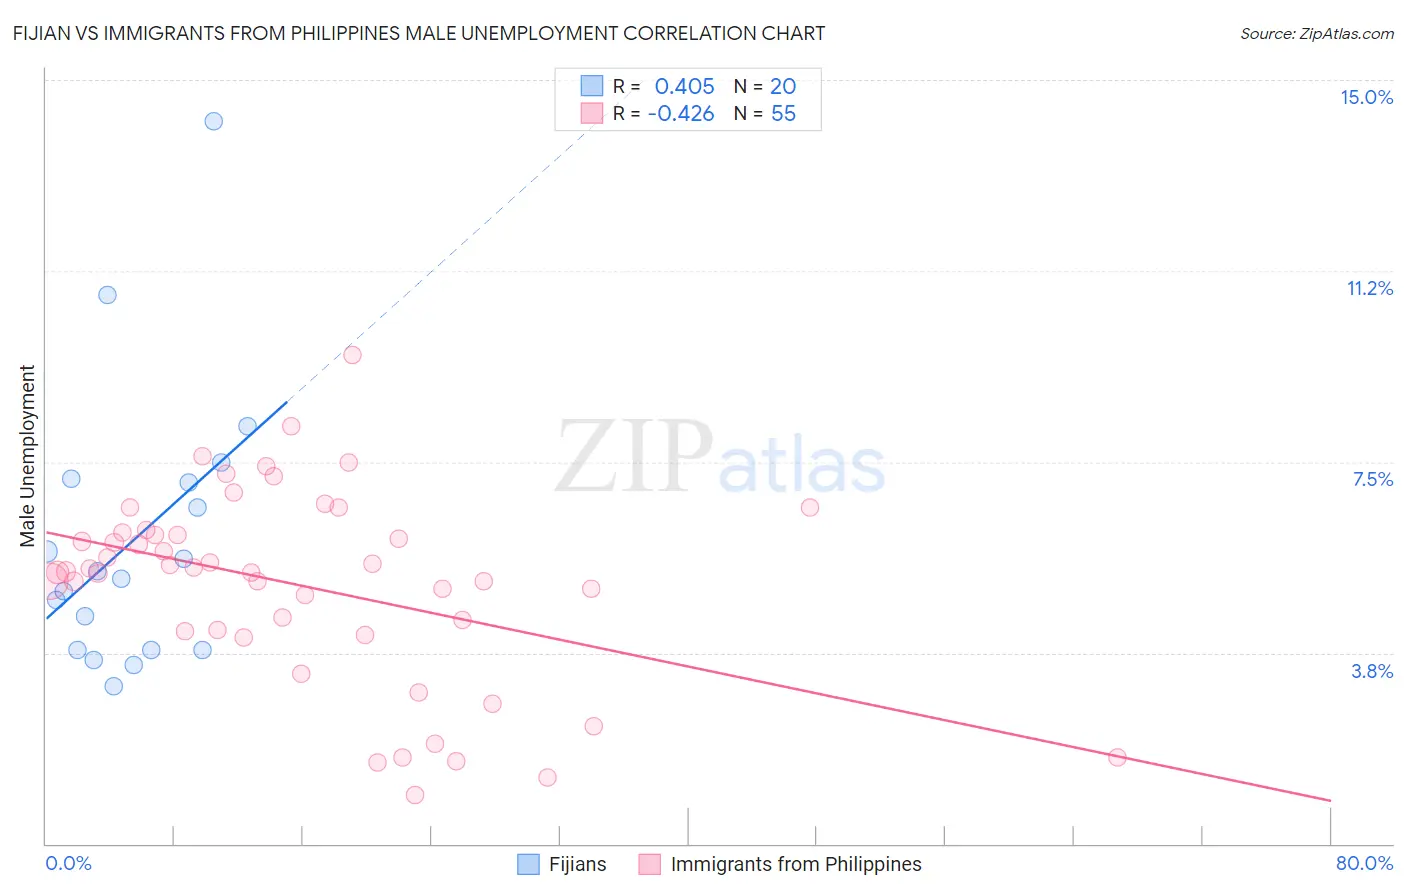
Fijian vs Immigrants from Philippines Male Unemployment Correlation Chart
The statistical analysis conducted on geographies consisting of 55,914,259 people shows a moderate positive correlation between the proportion of Fijians and unemployment rate among males in the United States with a correlation coefficient (R) of 0.405 and weighted average of 5.2%. Similarly, the statistical analysis conducted on geographies consisting of 468,596,641 people shows a moderate negative correlation between the proportion of Immigrants from Philippines and unemployment rate among males in the United States with a correlation coefficient (R) of -0.426 and weighted average of 5.4%, a difference of 4.7%.
Male Unemployment Correlation Summary
| Measurement | Fijian | Immigrants from Philippines |
| Minimum | 3.1% | 0.95% |
| Maximum | 14.2% | 9.6% |
| Range | 11.1% | 8.6% |
| Mean | 6.0% | 5.1% |
| Median | 5.3% | 5.3% |
| Interquartile 25% (IQ1) | 3.8% | 4.2% |
| Interquartile 75% (IQ3) | 7.1% | 6.1% |
| Interquartile Range (IQR) | 3.3% | 1.9% |
| Standard Deviation (Sample) | 2.7% | 1.9% |
| Standard Deviation (Population) | 2.7% | 1.9% |
Similar Demographics by Male Unemployment
Demographics Similar to Fijians by Male Unemployment
In terms of male unemployment, the demographic groups most similar to Fijians are Syrian (5.2%, a difference of 0.030%), Sri Lankan (5.2%, a difference of 0.030%), Macedonian (5.2%, a difference of 0.050%), Immigrants from Kenya (5.2%, a difference of 0.050%), and Immigrants from Burma/Myanmar (5.2%, a difference of 0.070%).
| Demographics | Rating | Rank | Male Unemployment |
| Immigrants | Saudi Arabia | 80.1 /100 | #135 | Excellent 5.2% |
| Lebanese | 79.9 /100 | #136 | Good 5.2% |
| Immigrants | Eastern Africa | 79.8 /100 | #137 | Good 5.2% |
| Immigrants | Croatia | 79.7 /100 | #138 | Good 5.2% |
| Kenyans | 79.4 /100 | #139 | Good 5.2% |
| Brazilians | 79.3 /100 | #140 | Good 5.2% |
| Immigrants | Switzerland | 79.2 /100 | #141 | Good 5.2% |
| Fijians | 78.3 /100 | #142 | Good 5.2% |
| Syrians | 78.0 /100 | #143 | Good 5.2% |
| Sri Lankans | 77.9 /100 | #144 | Good 5.2% |
| Macedonians | 77.7 /100 | #145 | Good 5.2% |
| Immigrants | Kenya | 77.6 /100 | #146 | Good 5.2% |
| Immigrants | Burma/Myanmar | 77.5 /100 | #147 | Good 5.2% |
| Immigrants | Italy | 76.3 /100 | #148 | Good 5.2% |
| Immigrants | Europe | 76.2 /100 | #149 | Good 5.2% |
Demographics Similar to Immigrants from Philippines by Male Unemployment
In terms of male unemployment, the demographic groups most similar to Immigrants from Philippines are Immigrants from Zaire (5.4%, a difference of 0.020%), Nonimmigrants (5.4%, a difference of 0.040%), Immigrants from Laos (5.4%, a difference of 0.050%), Immigrants from Greece (5.4%, a difference of 0.12%), and Immigrants from Thailand (5.4%, a difference of 0.15%).
| Demographics | Rating | Rank | Male Unemployment |
| Spanish | 19.7 /100 | #194 | Poor 5.4% |
| Immigrants | Southern Europe | 17.7 /100 | #195 | Poor 5.4% |
| Albanians | 17.3 /100 | #196 | Poor 5.4% |
| Alsatians | 16.7 /100 | #197 | Poor 5.4% |
| Immigrants | Thailand | 14.7 /100 | #198 | Poor 5.4% |
| Immigrants | Greece | 14.5 /100 | #199 | Poor 5.4% |
| Immigrants | Zaire | 13.7 /100 | #200 | Poor 5.4% |
| Immigrants | Philippines | 13.5 /100 | #201 | Poor 5.4% |
| Immigrants | Nonimmigrants | 13.1 /100 | #202 | Poor 5.4% |
| Immigrants | Laos | 13.0 /100 | #203 | Poor 5.4% |
| Guamanians/Chamorros | 12.3 /100 | #204 | Poor 5.4% |
| Immigrants | Costa Rica | 11.4 /100 | #205 | Poor 5.5% |
| Immigrants | Ukraine | 9.9 /100 | #206 | Tragic 5.5% |
| Immigrants | Syria | 9.3 /100 | #207 | Tragic 5.5% |
| Immigrants | Lebanon | 8.6 /100 | #208 | Tragic 5.5% |