Immigrants from El Salvador vs Cajun Unemployment
COMPARE
Immigrants from El Salvador
Cajun
Unemployment
Unemployment Comparison
Immigrants from El Salvador
Cajuns
5.8%
UNEMPLOYMENT
0.1/ 100
METRIC RATING
269th/ 347
METRIC RANK
5.6%
UNEMPLOYMENT
0.8/ 100
METRIC RATING
249th/ 347
METRIC RANK
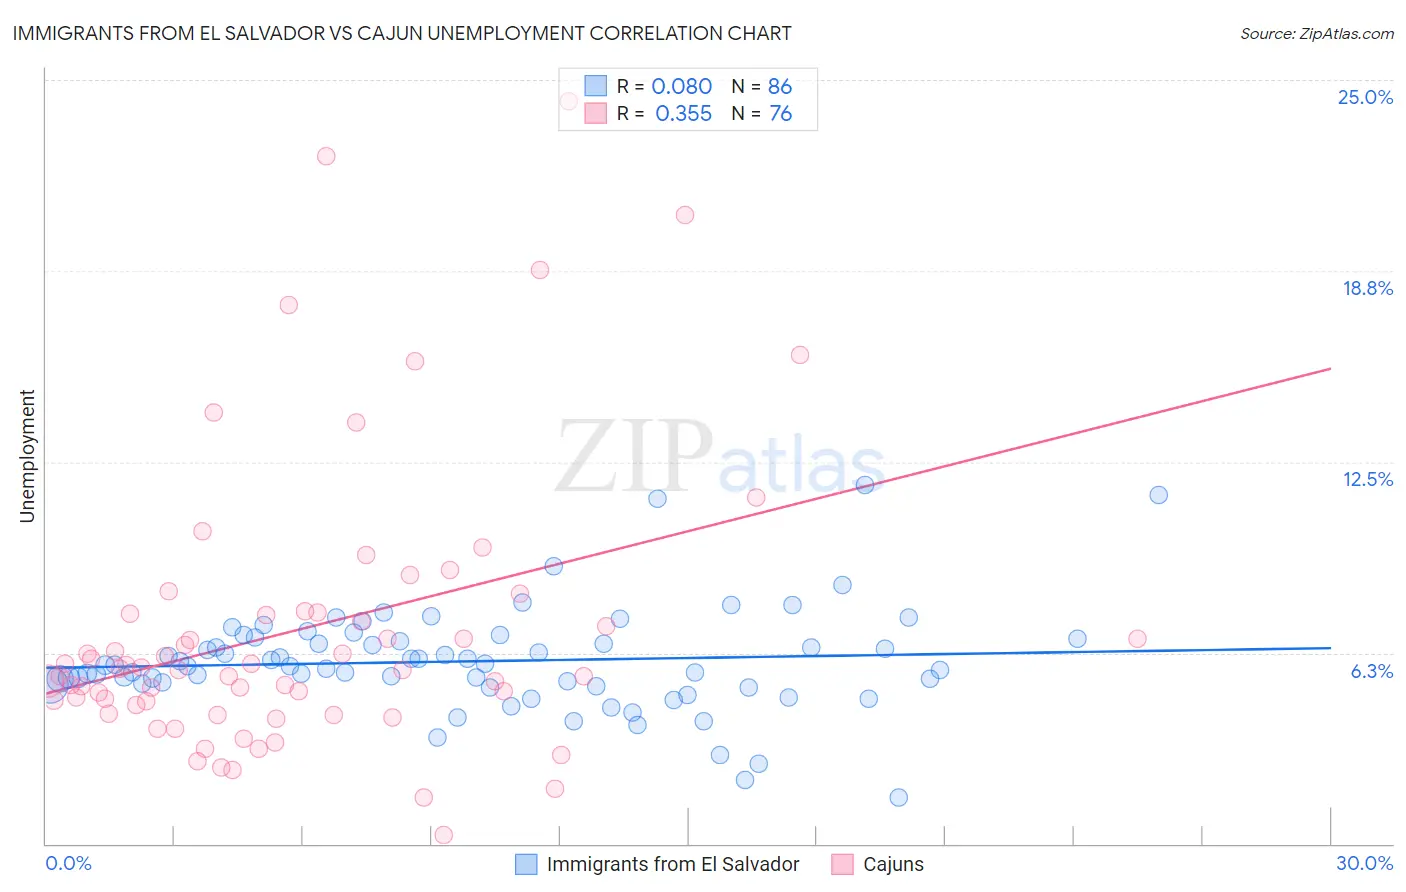
Immigrants from El Salvador vs Cajun Unemployment Correlation Chart
The statistical analysis conducted on geographies consisting of 357,477,552 people shows a slight positive correlation between the proportion of Immigrants from El Salvador and unemployment in the United States with a correlation coefficient (R) of 0.080 and weighted average of 5.8%. Similarly, the statistical analysis conducted on geographies consisting of 149,579,258 people shows a mild positive correlation between the proportion of Cajuns and unemployment in the United States with a correlation coefficient (R) of 0.355 and weighted average of 5.6%, a difference of 3.4%.
Unemployment Correlation Summary
| Measurement | Immigrants from El Salvador | Cajun |
| Minimum | 1.5% | 0.30% |
| Maximum | 11.7% | 24.3% |
| Range | 10.2% | 24.0% |
| Mean | 6.0% | 7.0% |
| Median | 5.8% | 5.7% |
| Interquartile 25% (IQ1) | 5.3% | 4.6% |
| Interquartile 75% (IQ3) | 6.7% | 7.5% |
| Interquartile Range (IQR) | 1.4% | 2.9% |
| Standard Deviation (Sample) | 1.7% | 4.7% |
| Standard Deviation (Population) | 1.7% | 4.7% |
Demographics Similar to Immigrants from El Salvador and Cajuns by Unemployment
In terms of unemployment, the demographic groups most similar to Immigrants from El Salvador are Immigrants from Sierra Leone (5.8%, a difference of 0.010%), Immigrants from Nigeria (5.8%, a difference of 0.050%), Mexican American Indian (5.8%, a difference of 0.12%), Nigerian (5.8%, a difference of 0.52%), and Immigrants from Liberia (5.8%, a difference of 0.59%). Similarly, the demographic groups most similar to Cajuns are Japanese (5.6%, a difference of 0.010%), Kiowa (5.7%, a difference of 0.48%), Honduran (5.7%, a difference of 1.2%), Central American (5.7%, a difference of 1.2%), and Immigrants from Honduras (5.7%, a difference of 1.3%).
| Demographics | Rating | Rank | Unemployment |
| Cajuns | 0.8 /100 | #249 | Tragic 5.6% |
| Japanese | 0.8 /100 | #250 | Tragic 5.6% |
| Kiowa | 0.6 /100 | #251 | Tragic 5.7% |
| Hondurans | 0.3 /100 | #252 | Tragic 5.7% |
| Central Americans | 0.3 /100 | #253 | Tragic 5.7% |
| Immigrants | Honduras | 0.3 /100 | #254 | Tragic 5.7% |
| Immigrants | Portugal | 0.2 /100 | #255 | Tragic 5.7% |
| Guatemalans | 0.2 /100 | #256 | Tragic 5.8% |
| Yaqui | 0.2 /100 | #257 | Tragic 5.8% |
| Immigrants | Bahamas | 0.1 /100 | #258 | Tragic 5.8% |
| Sub-Saharan Africans | 0.1 /100 | #259 | Tragic 5.8% |
| Immigrants | Uzbekistan | 0.1 /100 | #260 | Tragic 5.8% |
| Immigrants | Guatemala | 0.1 /100 | #261 | Tragic 5.8% |
| Sierra Leoneans | 0.1 /100 | #262 | Tragic 5.8% |
| Salvadorans | 0.1 /100 | #263 | Tragic 5.8% |
| Immigrants | Liberia | 0.1 /100 | #264 | Tragic 5.8% |
| Nigerians | 0.1 /100 | #265 | Tragic 5.8% |
| Mexican American Indians | 0.1 /100 | #266 | Tragic 5.8% |
| Immigrants | Nigeria | 0.1 /100 | #267 | Tragic 5.8% |
| Immigrants | Sierra Leone | 0.1 /100 | #268 | Tragic 5.8% |
| Immigrants | El Salvador | 0.1 /100 | #269 | Tragic 5.8% |