Immigrants from El Salvador vs Taiwanese Unemployment
COMPARE
Immigrants from El Salvador
Taiwanese
Unemployment
Unemployment Comparison
Immigrants from El Salvador
Taiwanese
5.8%
UNEMPLOYMENT
0.1/ 100
METRIC RATING
269th/ 347
METRIC RANK
5.3%
UNEMPLOYMENT
49.6/ 100
METRIC RATING
175th/ 347
METRIC RANK
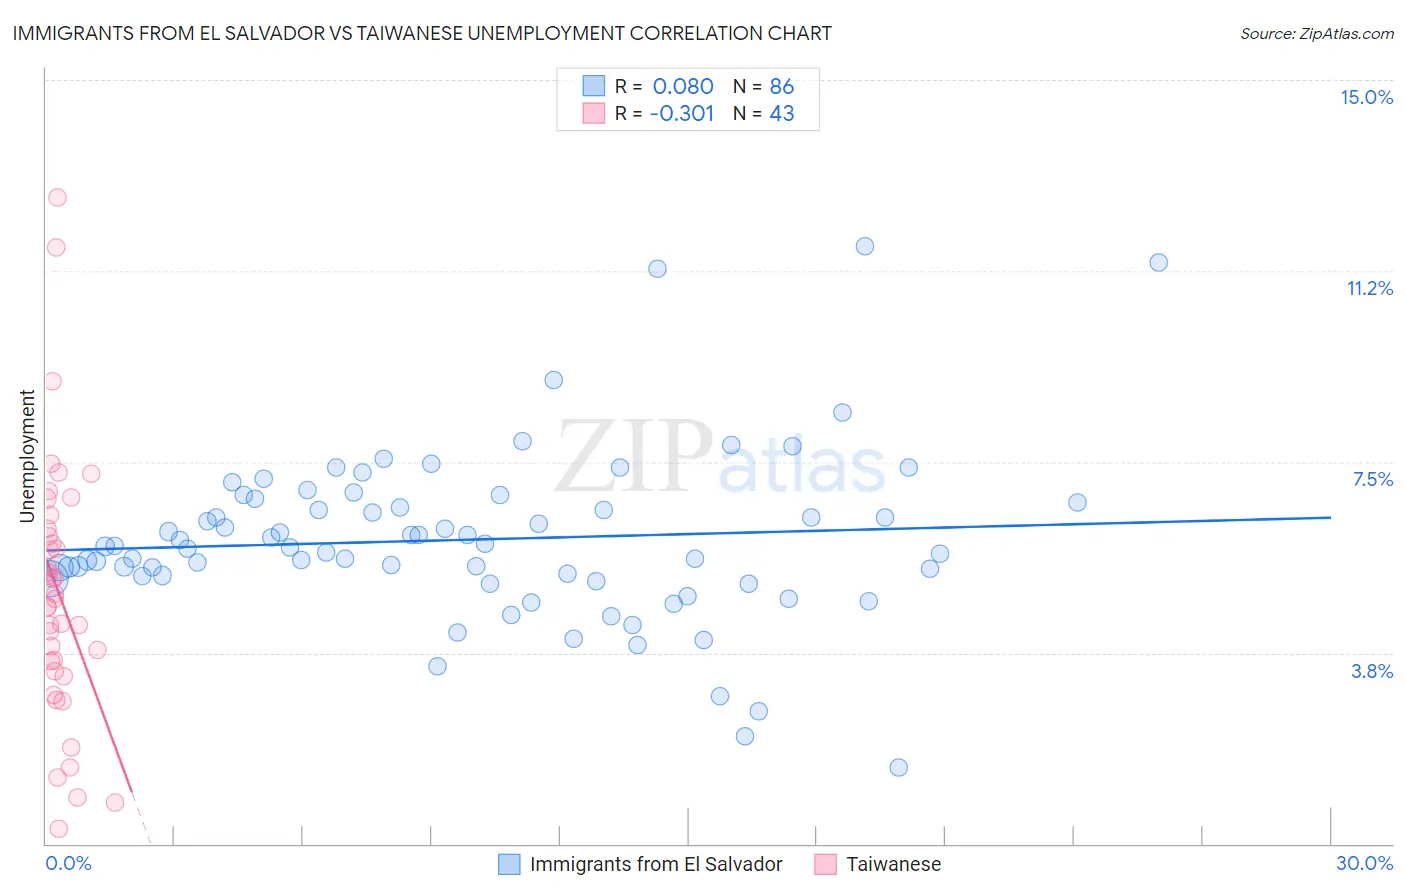
Immigrants from El Salvador vs Taiwanese Unemployment Correlation Chart
The statistical analysis conducted on geographies consisting of 357,477,552 people shows a slight positive correlation between the proportion of Immigrants from El Salvador and unemployment in the United States with a correlation coefficient (R) of 0.080 and weighted average of 5.8%. Similarly, the statistical analysis conducted on geographies consisting of 31,724,466 people shows a mild negative correlation between the proportion of Taiwanese and unemployment in the United States with a correlation coefficient (R) of -0.301 and weighted average of 5.3%, a difference of 11.1%.
Unemployment Correlation Summary
| Measurement | Immigrants from El Salvador | Taiwanese |
| Minimum | 1.5% | 0.30% |
| Maximum | 11.7% | 12.7% |
| Range | 10.2% | 12.4% |
| Mean | 6.0% | 4.9% |
| Median | 5.8% | 4.8% |
| Interquartile 25% (IQ1) | 5.3% | 3.4% |
| Interquartile 75% (IQ3) | 6.7% | 6.2% |
| Interquartile Range (IQR) | 1.4% | 2.8% |
| Standard Deviation (Sample) | 1.7% | 2.6% |
| Standard Deviation (Population) | 1.7% | 2.5% |
Similar Demographics by Unemployment
Demographics Similar to Immigrants from El Salvador by Unemployment
In terms of unemployment, the demographic groups most similar to Immigrants from El Salvador are Immigrants from Sierra Leone (5.8%, a difference of 0.010%), Immigrants from Nigeria (5.8%, a difference of 0.050%), Blackfeet (5.8%, a difference of 0.080%), Mexican American Indian (5.8%, a difference of 0.12%), and Mexican (5.9%, a difference of 0.31%).
| Demographics | Rating | Rank | Unemployment |
| Sierra Leoneans | 0.1 /100 | #262 | Tragic 5.8% |
| Salvadorans | 0.1 /100 | #263 | Tragic 5.8% |
| Immigrants | Liberia | 0.1 /100 | #264 | Tragic 5.8% |
| Nigerians | 0.1 /100 | #265 | Tragic 5.8% |
| Mexican American Indians | 0.1 /100 | #266 | Tragic 5.8% |
| Immigrants | Nigeria | 0.1 /100 | #267 | Tragic 5.8% |
| Immigrants | Sierra Leone | 0.1 /100 | #268 | Tragic 5.8% |
| Immigrants | El Salvador | 0.1 /100 | #269 | Tragic 5.8% |
| Blackfeet | 0.1 /100 | #270 | Tragic 5.8% |
| Mexicans | 0.1 /100 | #271 | Tragic 5.9% |
| Hispanics or Latinos | 0.0 /100 | #272 | Tragic 5.9% |
| Immigrants | Fiji | 0.0 /100 | #273 | Tragic 5.9% |
| Bahamians | 0.0 /100 | #274 | Tragic 5.9% |
| Immigrants | Latin America | 0.0 /100 | #275 | Tragic 5.9% |
| Immigrants | Central America | 0.0 /100 | #276 | Tragic 6.0% |
Demographics Similar to Taiwanese by Unemployment
In terms of unemployment, the demographic groups most similar to Taiwanese are Immigrants from Congo (5.3%, a difference of 0.020%), Nicaraguan (5.3%, a difference of 0.060%), Nonimmigrants (5.3%, a difference of 0.11%), Immigrants from Poland (5.3%, a difference of 0.13%), and Afghan (5.3%, a difference of 0.14%).
| Demographics | Rating | Rank | Unemployment |
| Uruguayans | 60.2 /100 | #168 | Good 5.2% |
| Immigrants | Morocco | 59.1 /100 | #169 | Average 5.2% |
| Immigrants | Nicaragua | 57.1 /100 | #170 | Average 5.2% |
| Puget Sound Salish | 56.6 /100 | #171 | Average 5.2% |
| Immigrants | Vietnam | 52.5 /100 | #172 | Average 5.2% |
| Immigrants | Poland | 51.8 /100 | #173 | Average 5.3% |
| Immigrants | Congo | 50.0 /100 | #174 | Average 5.3% |
| Taiwanese | 49.6 /100 | #175 | Average 5.3% |
| Nicaraguans | 48.7 /100 | #176 | Average 5.3% |
| Immigrants | Nonimmigrants | 47.9 /100 | #177 | Average 5.3% |
| Afghans | 47.4 /100 | #178 | Average 5.3% |
| Malaysians | 46.8 /100 | #179 | Average 5.3% |
| Immigrants | Greece | 45.0 /100 | #180 | Average 5.3% |
| Albanians | 43.5 /100 | #181 | Average 5.3% |
| Spaniards | 42.2 /100 | #182 | Average 5.3% |