Bhutanese vs Cajun Unemployment
COMPARE
Bhutanese
Cajun
Unemployment
Unemployment Comparison
Bhutanese
Cajuns
4.9%
UNEMPLOYMENT
99.0/ 100
METRIC RATING
59th/ 347
METRIC RANK
5.6%
UNEMPLOYMENT
0.8/ 100
METRIC RATING
249th/ 347
METRIC RANK
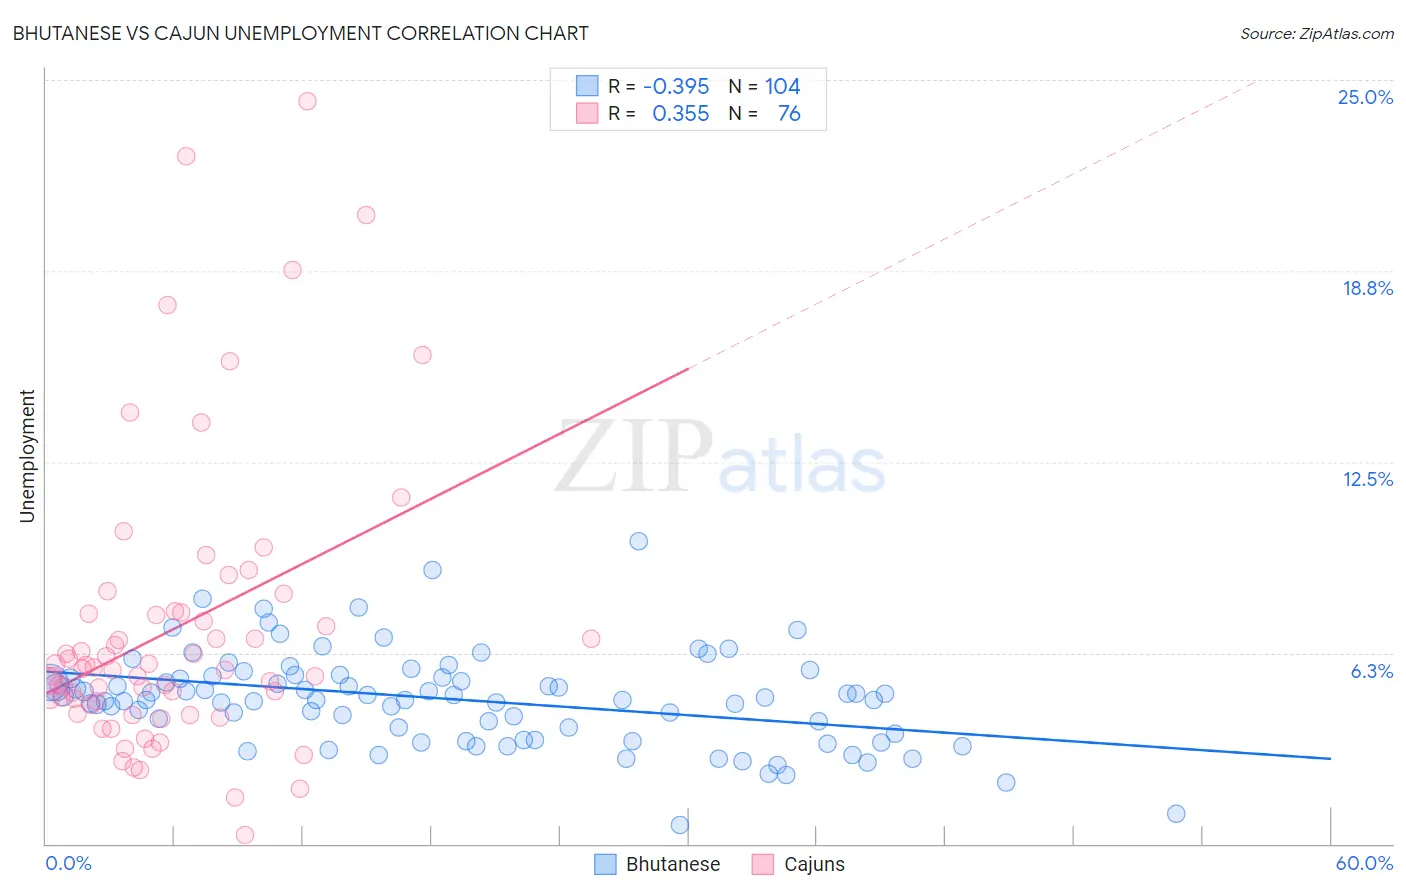
Bhutanese vs Cajun Unemployment Correlation Chart
The statistical analysis conducted on geographies consisting of 454,875,452 people shows a mild negative correlation between the proportion of Bhutanese and unemployment in the United States with a correlation coefficient (R) of -0.395 and weighted average of 4.9%. Similarly, the statistical analysis conducted on geographies consisting of 149,579,258 people shows a mild positive correlation between the proportion of Cajuns and unemployment in the United States with a correlation coefficient (R) of 0.355 and weighted average of 5.6%, a difference of 15.5%.
Unemployment Correlation Summary
| Measurement | Bhutanese | Cajun |
| Minimum | 0.60% | 0.30% |
| Maximum | 9.9% | 24.3% |
| Range | 9.3% | 24.0% |
| Mean | 4.7% | 7.0% |
| Median | 4.8% | 5.7% |
| Interquartile 25% (IQ1) | 3.7% | 4.6% |
| Interquartile 75% (IQ3) | 5.5% | 7.5% |
| Interquartile Range (IQR) | 1.8% | 2.9% |
| Standard Deviation (Sample) | 1.5% | 4.7% |
| Standard Deviation (Population) | 1.5% | 4.7% |
Similar Demographics by Unemployment
Demographics Similar to Bhutanese by Unemployment
In terms of unemployment, the demographic groups most similar to Bhutanese are Greek (4.9%, a difference of 0.030%), Immigrants from Netherlands (4.9%, a difference of 0.050%), Cambodian (4.9%, a difference of 0.050%), Icelander (4.9%, a difference of 0.060%), and Immigrants from Bulgaria (4.9%, a difference of 0.070%).
| Demographics | Rating | Rank | Unemployment |
| Whites/Caucasians | 99.2 /100 | #52 | Exceptional 4.9% |
| Immigrants | Zimbabwe | 99.2 /100 | #53 | Exceptional 4.9% |
| Eastern Europeans | 99.2 /100 | #54 | Exceptional 4.9% |
| Australians | 99.2 /100 | #55 | Exceptional 4.9% |
| Celtics | 99.1 /100 | #56 | Exceptional 4.9% |
| Immigrants | Singapore | 99.1 /100 | #57 | Exceptional 4.9% |
| Greeks | 99.0 /100 | #58 | Exceptional 4.9% |
| Bhutanese | 99.0 /100 | #59 | Exceptional 4.9% |
| Immigrants | Netherlands | 99.0 /100 | #60 | Exceptional 4.9% |
| Cambodians | 99.0 /100 | #61 | Exceptional 4.9% |
| Icelanders | 98.9 /100 | #62 | Exceptional 4.9% |
| Immigrants | Bulgaria | 98.9 /100 | #63 | Exceptional 4.9% |
| Italians | 98.9 /100 | #64 | Exceptional 4.9% |
| Immigrants | Canada | 98.8 /100 | #65 | Exceptional 4.9% |
| Slovaks | 98.7 /100 | #66 | Exceptional 4.9% |
Demographics Similar to Cajuns by Unemployment
In terms of unemployment, the demographic groups most similar to Cajuns are Japanese (5.6%, a difference of 0.010%), Liberian (5.6%, a difference of 0.26%), Immigrants from Cameroon (5.6%, a difference of 0.39%), Kiowa (5.7%, a difference of 0.48%), and Bermudan (5.6%, a difference of 0.54%).
| Demographics | Rating | Rank | Unemployment |
| Spanish Americans | 2.0 /100 | #242 | Tragic 5.6% |
| Marshallese | 1.3 /100 | #243 | Tragic 5.6% |
| Dutch West Indians | 1.2 /100 | #244 | Tragic 5.6% |
| French American Indians | 1.2 /100 | #245 | Tragic 5.6% |
| Bermudans | 1.1 /100 | #246 | Tragic 5.6% |
| Immigrants | Cameroon | 1.0 /100 | #247 | Tragic 5.6% |
| Liberians | 0.9 /100 | #248 | Tragic 5.6% |
| Cajuns | 0.8 /100 | #249 | Tragic 5.6% |
| Japanese | 0.8 /100 | #250 | Tragic 5.6% |
| Kiowa | 0.6 /100 | #251 | Tragic 5.7% |
| Hondurans | 0.3 /100 | #252 | Tragic 5.7% |
| Central Americans | 0.3 /100 | #253 | Tragic 5.7% |
| Immigrants | Honduras | 0.3 /100 | #254 | Tragic 5.7% |
| Immigrants | Portugal | 0.2 /100 | #255 | Tragic 5.7% |
| Guatemalans | 0.2 /100 | #256 | Tragic 5.8% |