Korean vs Cajun Unemployment
COMPARE
Korean
Cajun
Unemployment
Unemployment Comparison
Koreans
Cajuns
5.3%
UNEMPLOYMENT
27.4/ 100
METRIC RATING
200th/ 347
METRIC RANK
5.6%
UNEMPLOYMENT
0.8/ 100
METRIC RATING
249th/ 347
METRIC RANK
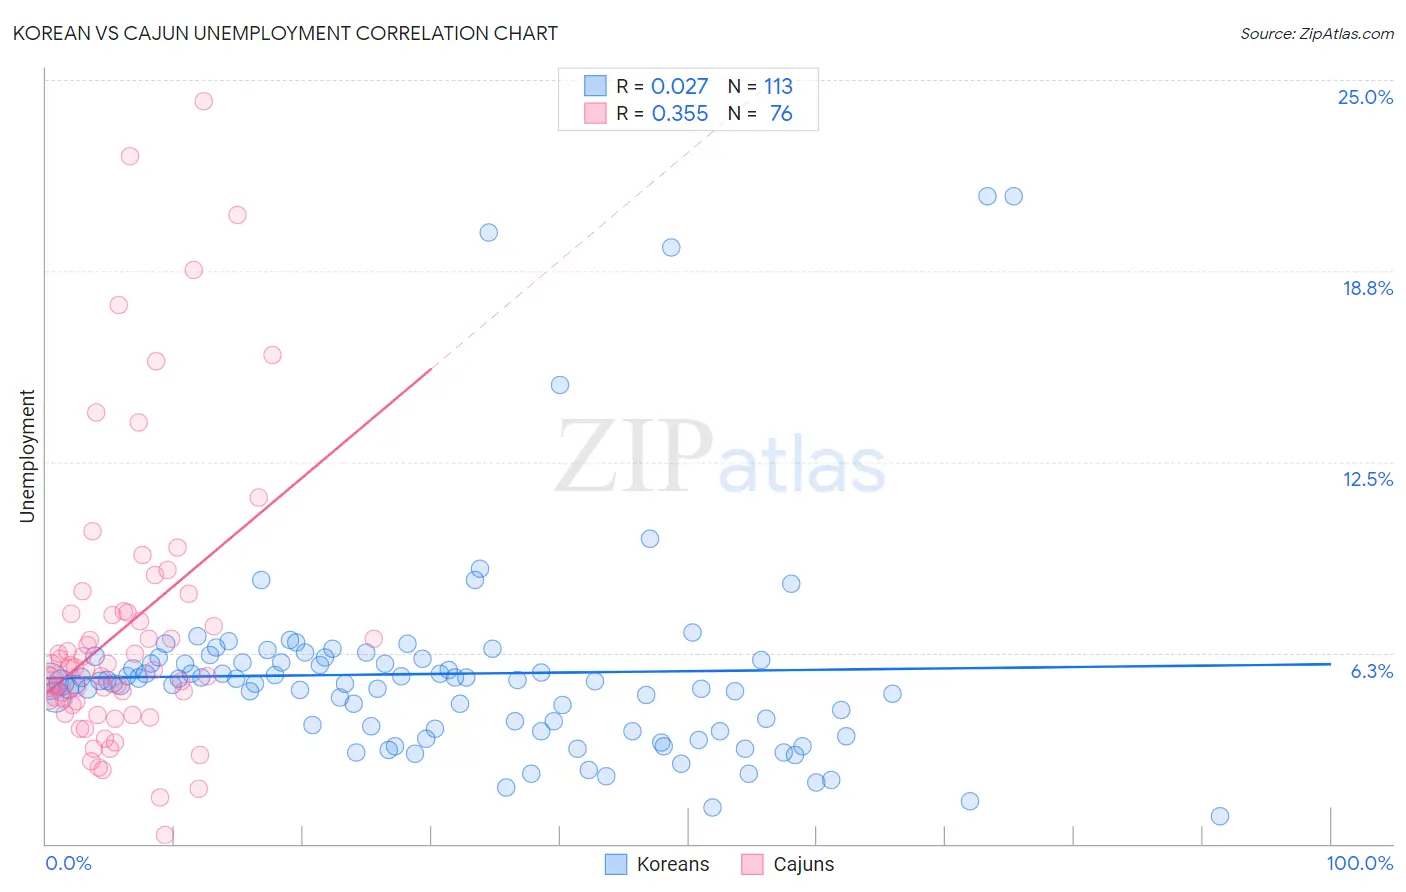
Korean vs Cajun Unemployment Correlation Chart
The statistical analysis conducted on geographies consisting of 509,828,935 people shows no correlation between the proportion of Koreans and unemployment in the United States with a correlation coefficient (R) of 0.027 and weighted average of 5.3%. Similarly, the statistical analysis conducted on geographies consisting of 149,579,258 people shows a mild positive correlation between the proportion of Cajuns and unemployment in the United States with a correlation coefficient (R) of 0.355 and weighted average of 5.6%, a difference of 5.8%.
Unemployment Correlation Summary
| Measurement | Korean | Cajun |
| Minimum | 0.90% | 0.30% |
| Maximum | 21.2% | 24.3% |
| Range | 20.3% | 24.0% |
| Mean | 5.6% | 7.0% |
| Median | 5.3% | 5.7% |
| Interquartile 25% (IQ1) | 3.7% | 4.6% |
| Interquartile 75% (IQ3) | 6.0% | 7.5% |
| Interquartile Range (IQR) | 2.3% | 2.9% |
| Standard Deviation (Sample) | 3.4% | 4.7% |
| Standard Deviation (Population) | 3.4% | 4.7% |
Similar Demographics by Unemployment
Demographics Similar to Koreans by Unemployment
In terms of unemployment, the demographic groups most similar to Koreans are Immigrants from South Eastern Asia (5.3%, a difference of 0.030%), Immigrants from Israel (5.3%, a difference of 0.090%), Immigrants from Afghanistan (5.3%, a difference of 0.090%), Cherokee (5.3%, a difference of 0.14%), and Immigrants from Micronesia (5.3%, a difference of 0.17%).
| Demographics | Rating | Rank | Unemployment |
| Immigrants | Somalia | 33.8 /100 | #193 | Fair 5.3% |
| Immigrants | Laos | 30.9 /100 | #194 | Fair 5.3% |
| Immigrants | Southern Europe | 30.9 /100 | #195 | Fair 5.3% |
| Peruvians | 29.9 /100 | #196 | Fair 5.3% |
| Immigrants | Uruguay | 29.8 /100 | #197 | Fair 5.3% |
| Immigrants | Israel | 28.6 /100 | #198 | Fair 5.3% |
| Immigrants | Afghanistan | 28.6 /100 | #199 | Fair 5.3% |
| Koreans | 27.4 /100 | #200 | Fair 5.3% |
| Immigrants | South Eastern Asia | 27.0 /100 | #201 | Fair 5.3% |
| Cherokee | 25.5 /100 | #202 | Fair 5.3% |
| Immigrants | Micronesia | 25.2 /100 | #203 | Fair 5.3% |
| Immigrants | Ukraine | 24.9 /100 | #204 | Fair 5.3% |
| Native Hawaiians | 24.1 /100 | #205 | Fair 5.3% |
| Immigrants | Peru | 22.7 /100 | #206 | Fair 5.4% |
| Creek | 19.4 /100 | #207 | Poor 5.4% |
Demographics Similar to Cajuns by Unemployment
In terms of unemployment, the demographic groups most similar to Cajuns are Japanese (5.6%, a difference of 0.010%), Liberian (5.6%, a difference of 0.26%), Immigrants from Cameroon (5.6%, a difference of 0.39%), Kiowa (5.7%, a difference of 0.48%), and Bermudan (5.6%, a difference of 0.54%).
| Demographics | Rating | Rank | Unemployment |
| Spanish Americans | 2.0 /100 | #242 | Tragic 5.6% |
| Marshallese | 1.3 /100 | #243 | Tragic 5.6% |
| Dutch West Indians | 1.2 /100 | #244 | Tragic 5.6% |
| French American Indians | 1.2 /100 | #245 | Tragic 5.6% |
| Bermudans | 1.1 /100 | #246 | Tragic 5.6% |
| Immigrants | Cameroon | 1.0 /100 | #247 | Tragic 5.6% |
| Liberians | 0.9 /100 | #248 | Tragic 5.6% |
| Cajuns | 0.8 /100 | #249 | Tragic 5.6% |
| Japanese | 0.8 /100 | #250 | Tragic 5.6% |
| Kiowa | 0.6 /100 | #251 | Tragic 5.7% |
| Hondurans | 0.3 /100 | #252 | Tragic 5.7% |
| Central Americans | 0.3 /100 | #253 | Tragic 5.7% |
| Immigrants | Honduras | 0.3 /100 | #254 | Tragic 5.7% |
| Immigrants | Portugal | 0.2 /100 | #255 | Tragic 5.7% |
| Guatemalans | 0.2 /100 | #256 | Tragic 5.8% |