Immigrants from El Salvador vs Immigrants from Israel Unemployment
COMPARE
Immigrants from El Salvador
Immigrants from Israel
Unemployment
Unemployment Comparison
Immigrants from El Salvador
Immigrants from Israel
5.8%
UNEMPLOYMENT
0.1/ 100
METRIC RATING
269th/ 347
METRIC RANK
5.3%
UNEMPLOYMENT
28.6/ 100
METRIC RATING
198th/ 347
METRIC RANK
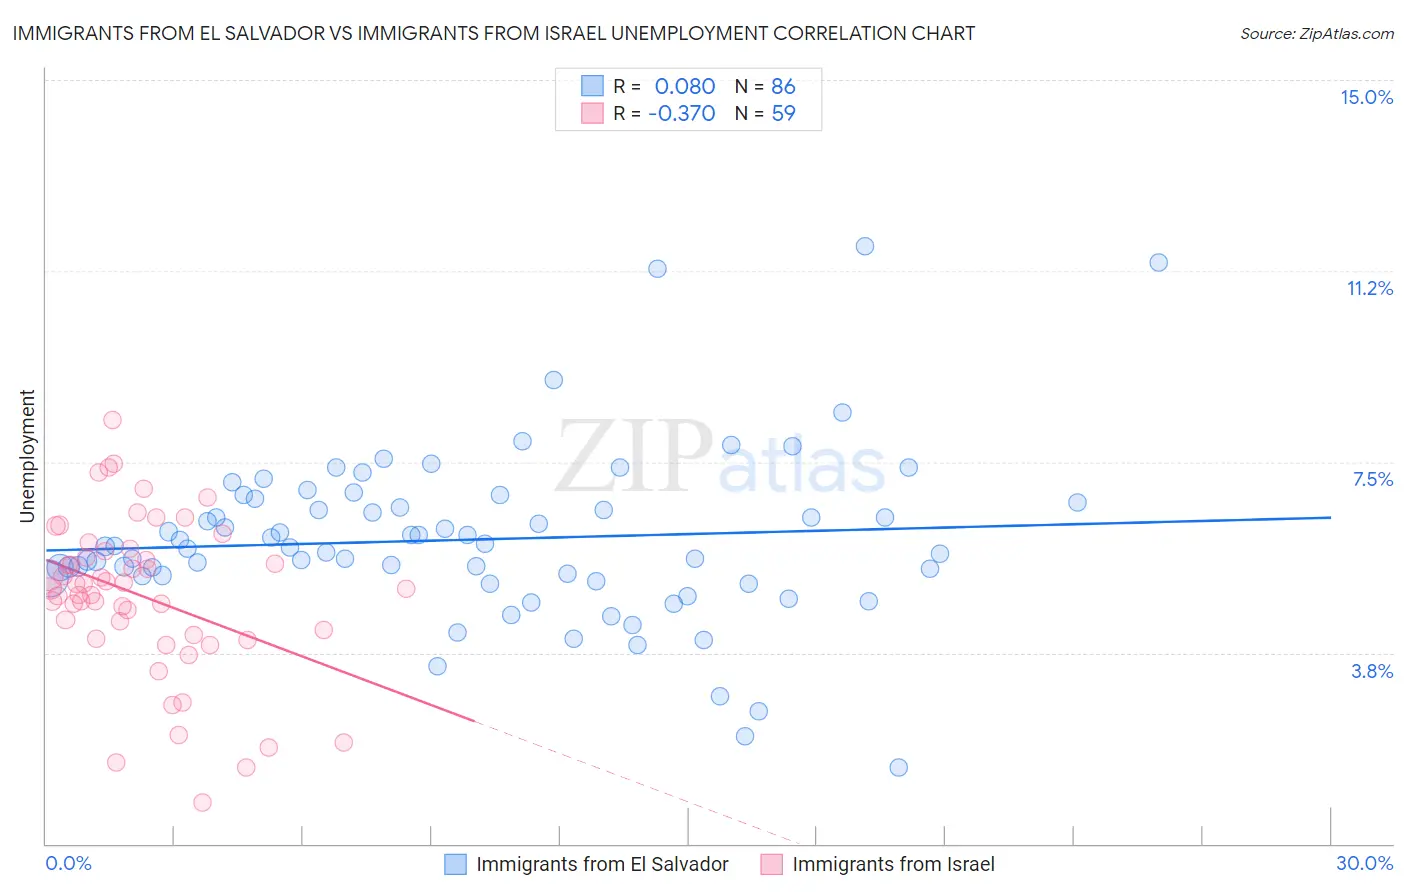
Immigrants from El Salvador vs Immigrants from Israel Unemployment Correlation Chart
The statistical analysis conducted on geographies consisting of 357,477,552 people shows a slight positive correlation between the proportion of Immigrants from El Salvador and unemployment in the United States with a correlation coefficient (R) of 0.080 and weighted average of 5.8%. Similarly, the statistical analysis conducted on geographies consisting of 209,971,087 people shows a mild negative correlation between the proportion of Immigrants from Israel and unemployment in the United States with a correlation coefficient (R) of -0.370 and weighted average of 5.3%, a difference of 9.6%.
Unemployment Correlation Summary
| Measurement | Immigrants from El Salvador | Immigrants from Israel |
| Minimum | 1.5% | 0.80% |
| Maximum | 11.7% | 8.3% |
| Range | 10.2% | 7.5% |
| Mean | 6.0% | 4.9% |
| Median | 5.8% | 5.0% |
| Interquartile 25% (IQ1) | 5.3% | 4.1% |
| Interquartile 75% (IQ3) | 6.7% | 5.7% |
| Interquartile Range (IQR) | 1.4% | 1.6% |
| Standard Deviation (Sample) | 1.7% | 1.5% |
| Standard Deviation (Population) | 1.7% | 1.5% |
Similar Demographics by Unemployment
Demographics Similar to Immigrants from El Salvador by Unemployment
In terms of unemployment, the demographic groups most similar to Immigrants from El Salvador are Immigrants from Sierra Leone (5.8%, a difference of 0.010%), Immigrants from Nigeria (5.8%, a difference of 0.050%), Blackfeet (5.8%, a difference of 0.080%), Mexican American Indian (5.8%, a difference of 0.12%), and Mexican (5.9%, a difference of 0.31%).
| Demographics | Rating | Rank | Unemployment |
| Sierra Leoneans | 0.1 /100 | #262 | Tragic 5.8% |
| Salvadorans | 0.1 /100 | #263 | Tragic 5.8% |
| Immigrants | Liberia | 0.1 /100 | #264 | Tragic 5.8% |
| Nigerians | 0.1 /100 | #265 | Tragic 5.8% |
| Mexican American Indians | 0.1 /100 | #266 | Tragic 5.8% |
| Immigrants | Nigeria | 0.1 /100 | #267 | Tragic 5.8% |
| Immigrants | Sierra Leone | 0.1 /100 | #268 | Tragic 5.8% |
| Immigrants | El Salvador | 0.1 /100 | #269 | Tragic 5.8% |
| Blackfeet | 0.1 /100 | #270 | Tragic 5.8% |
| Mexicans | 0.1 /100 | #271 | Tragic 5.9% |
| Hispanics or Latinos | 0.0 /100 | #272 | Tragic 5.9% |
| Immigrants | Fiji | 0.0 /100 | #273 | Tragic 5.9% |
| Bahamians | 0.0 /100 | #274 | Tragic 5.9% |
| Immigrants | Latin America | 0.0 /100 | #275 | Tragic 5.9% |
| Immigrants | Central America | 0.0 /100 | #276 | Tragic 6.0% |
Demographics Similar to Immigrants from Israel by Unemployment
In terms of unemployment, the demographic groups most similar to Immigrants from Israel are Immigrants from Afghanistan (5.3%, a difference of 0.0%), Peruvian (5.3%, a difference of 0.090%), Immigrants from Uruguay (5.3%, a difference of 0.090%), Korean (5.3%, a difference of 0.090%), and Immigrants from South Eastern Asia (5.3%, a difference of 0.12%).
| Demographics | Rating | Rank | Unemployment |
| Somalis | 34.0 /100 | #191 | Fair 5.3% |
| South Americans | 33.9 /100 | #192 | Fair 5.3% |
| Immigrants | Somalia | 33.8 /100 | #193 | Fair 5.3% |
| Immigrants | Laos | 30.9 /100 | #194 | Fair 5.3% |
| Immigrants | Southern Europe | 30.9 /100 | #195 | Fair 5.3% |
| Peruvians | 29.9 /100 | #196 | Fair 5.3% |
| Immigrants | Uruguay | 29.8 /100 | #197 | Fair 5.3% |
| Immigrants | Israel | 28.6 /100 | #198 | Fair 5.3% |
| Immigrants | Afghanistan | 28.6 /100 | #199 | Fair 5.3% |
| Koreans | 27.4 /100 | #200 | Fair 5.3% |
| Immigrants | South Eastern Asia | 27.0 /100 | #201 | Fair 5.3% |
| Cherokee | 25.5 /100 | #202 | Fair 5.3% |
| Immigrants | Micronesia | 25.2 /100 | #203 | Fair 5.3% |
| Immigrants | Ukraine | 24.9 /100 | #204 | Fair 5.3% |
| Native Hawaiians | 24.1 /100 | #205 | Fair 5.3% |