Immigrants from Eastern Asia vs Immigrants from Burma/Myanmar Unemployment Among Ages 35 to 44 years
COMPARE
Immigrants from Eastern Asia
Immigrants from Burma/Myanmar
Unemployment Among Ages 35 to 44 years
Unemployment Among Ages 35 to 44 years Comparison
Immigrants from Eastern Asia
Immigrants from Burma/Myanmar
4.4%
UNEMPLOYMENT AMONG AGES 35 TO 44 YEARS
97.8/ 100
METRIC RATING
51st/ 347
METRIC RANK
4.6%
UNEMPLOYMENT AMONG AGES 35 TO 44 YEARS
72.2/ 100
METRIC RATING
149th/ 347
METRIC RANK
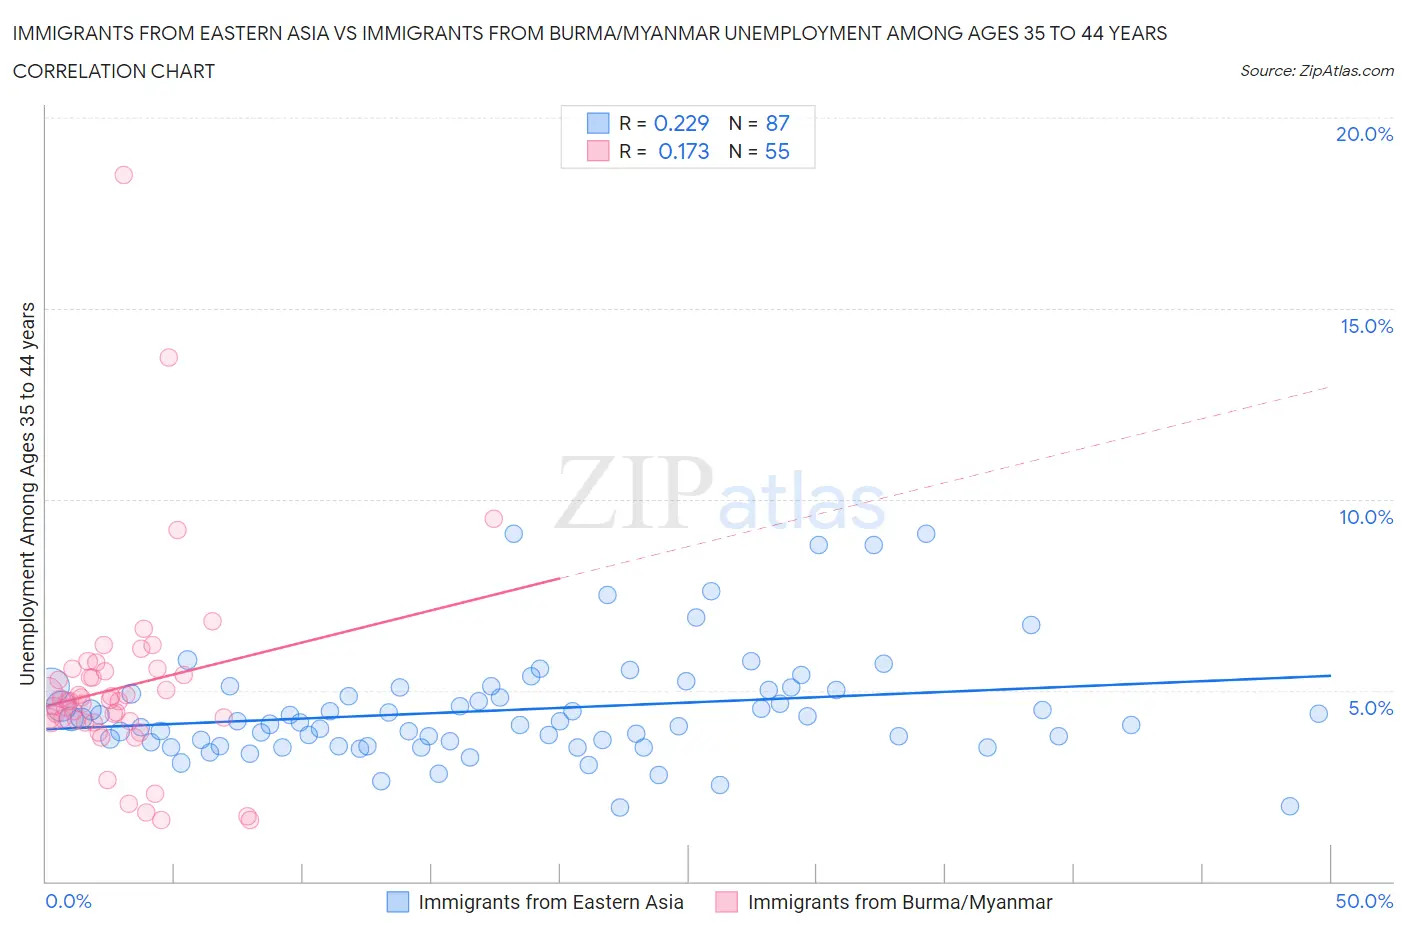
Immigrants from Eastern Asia vs Immigrants from Burma/Myanmar Unemployment Among Ages 35 to 44 years Correlation Chart
The statistical analysis conducted on geographies consisting of 481,023,005 people shows a weak positive correlation between the proportion of Immigrants from Eastern Asia and unemployment rate among population between the ages 35 and 44 in the United States with a correlation coefficient (R) of 0.229 and weighted average of 4.4%. Similarly, the statistical analysis conducted on geographies consisting of 171,415,766 people shows a poor positive correlation between the proportion of Immigrants from Burma/Myanmar and unemployment rate among population between the ages 35 and 44 in the United States with a correlation coefficient (R) of 0.173 and weighted average of 4.6%, a difference of 5.4%.
Unemployment Among Ages 35 to 44 years Correlation Summary
| Measurement | Immigrants from Eastern Asia | Immigrants from Burma/Myanmar |
| Minimum | 1.9% | 1.6% |
| Maximum | 9.1% | 18.5% |
| Range | 7.2% | 16.9% |
| Mean | 4.5% | 5.1% |
| Median | 4.2% | 4.7% |
| Interquartile 25% (IQ1) | 3.6% | 4.2% |
| Interquartile 75% (IQ3) | 5.0% | 5.5% |
| Interquartile Range (IQR) | 1.4% | 1.3% |
| Standard Deviation (Sample) | 1.4% | 2.7% |
| Standard Deviation (Population) | 1.4% | 2.7% |
Similar Demographics by Unemployment Among Ages 35 to 44 years
Demographics Similar to Immigrants from Eastern Asia by Unemployment Among Ages 35 to 44 years
In terms of unemployment among ages 35 to 44 years, the demographic groups most similar to Immigrants from Eastern Asia are Immigrants from Turkey (4.4%, a difference of 0.020%), Okinawan (4.4%, a difference of 0.020%), Immigrants from Argentina (4.4%, a difference of 0.16%), Asian (4.4%, a difference of 0.32%), and Immigrants from Moldova (4.4%, a difference of 0.35%).
| Demographics | Rating | Rank | Unemployment Among Ages 35 to 44 years |
| Immigrants | Malaysia | 98.7 /100 | #44 | Exceptional 4.3% |
| Immigrants | Korea | 98.4 /100 | #45 | Exceptional 4.3% |
| Immigrants | Belgium | 98.4 /100 | #46 | Exceptional 4.3% |
| British | 98.3 /100 | #47 | Exceptional 4.4% |
| Bhutanese | 98.2 /100 | #48 | Exceptional 4.4% |
| Swiss | 98.2 /100 | #49 | Exceptional 4.4% |
| Immigrants | Turkey | 97.8 /100 | #50 | Exceptional 4.4% |
| Immigrants | Eastern Asia | 97.8 /100 | #51 | Exceptional 4.4% |
| Okinawans | 97.7 /100 | #52 | Exceptional 4.4% |
| Immigrants | Argentina | 97.6 /100 | #53 | Exceptional 4.4% |
| Asians | 97.4 /100 | #54 | Exceptional 4.4% |
| Immigrants | Moldova | 97.3 /100 | #55 | Exceptional 4.4% |
| Chileans | 97.3 /100 | #56 | Exceptional 4.4% |
| Immigrants | Hong Kong | 97.2 /100 | #57 | Exceptional 4.4% |
| English | 97.2 /100 | #58 | Exceptional 4.4% |
Demographics Similar to Immigrants from Burma/Myanmar by Unemployment Among Ages 35 to 44 years
In terms of unemployment among ages 35 to 44 years, the demographic groups most similar to Immigrants from Burma/Myanmar are Slavic (4.6%, a difference of 0.020%), Immigrants from Vietnam (4.6%, a difference of 0.14%), Immigrants from England (4.6%, a difference of 0.15%), Immigrants from Denmark (4.6%, a difference of 0.20%), and Immigrants from Eastern Europe (4.6%, a difference of 0.23%).
| Demographics | Rating | Rank | Unemployment Among Ages 35 to 44 years |
| Ukrainians | 75.8 /100 | #142 | Good 4.6% |
| Immigrants | Switzerland | 75.5 /100 | #143 | Good 4.6% |
| Immigrants | Russia | 75.4 /100 | #144 | Good 4.6% |
| Immigrants | Eastern Europe | 74.7 /100 | #145 | Good 4.6% |
| Immigrants | Denmark | 74.4 /100 | #146 | Good 4.6% |
| Immigrants | Vietnam | 73.8 /100 | #147 | Good 4.6% |
| Slavs | 72.4 /100 | #148 | Good 4.6% |
| Immigrants | Burma/Myanmar | 72.2 /100 | #149 | Good 4.6% |
| Immigrants | England | 70.5 /100 | #150 | Good 4.6% |
| Puget Sound Salish | 67.1 /100 | #151 | Good 4.6% |
| Pakistanis | 67.1 /100 | #152 | Good 4.6% |
| Immigrants | Brazil | 67.0 /100 | #153 | Good 4.6% |
| Immigrants | Western Europe | 65.5 /100 | #154 | Good 4.6% |
| Whites/Caucasians | 64.9 /100 | #155 | Good 4.6% |
| South Americans | 63.7 /100 | #156 | Good 4.6% |