Immigrants from Eastern Asia vs Carpatho Rusyn Unemployment Among Ages 35 to 44 years
COMPARE
Immigrants from Eastern Asia
Carpatho Rusyn
Unemployment Among Ages 35 to 44 years
Unemployment Among Ages 35 to 44 years Comparison
Immigrants from Eastern Asia
Carpatho Rusyns
4.4%
UNEMPLOYMENT AMONG AGES 35 TO 44 YEARS
97.8/ 100
METRIC RATING
51st/ 347
METRIC RANK
4.3%
UNEMPLOYMENT AMONG AGES 35 TO 44 YEARS
99.2/ 100
METRIC RATING
31st/ 347
METRIC RANK
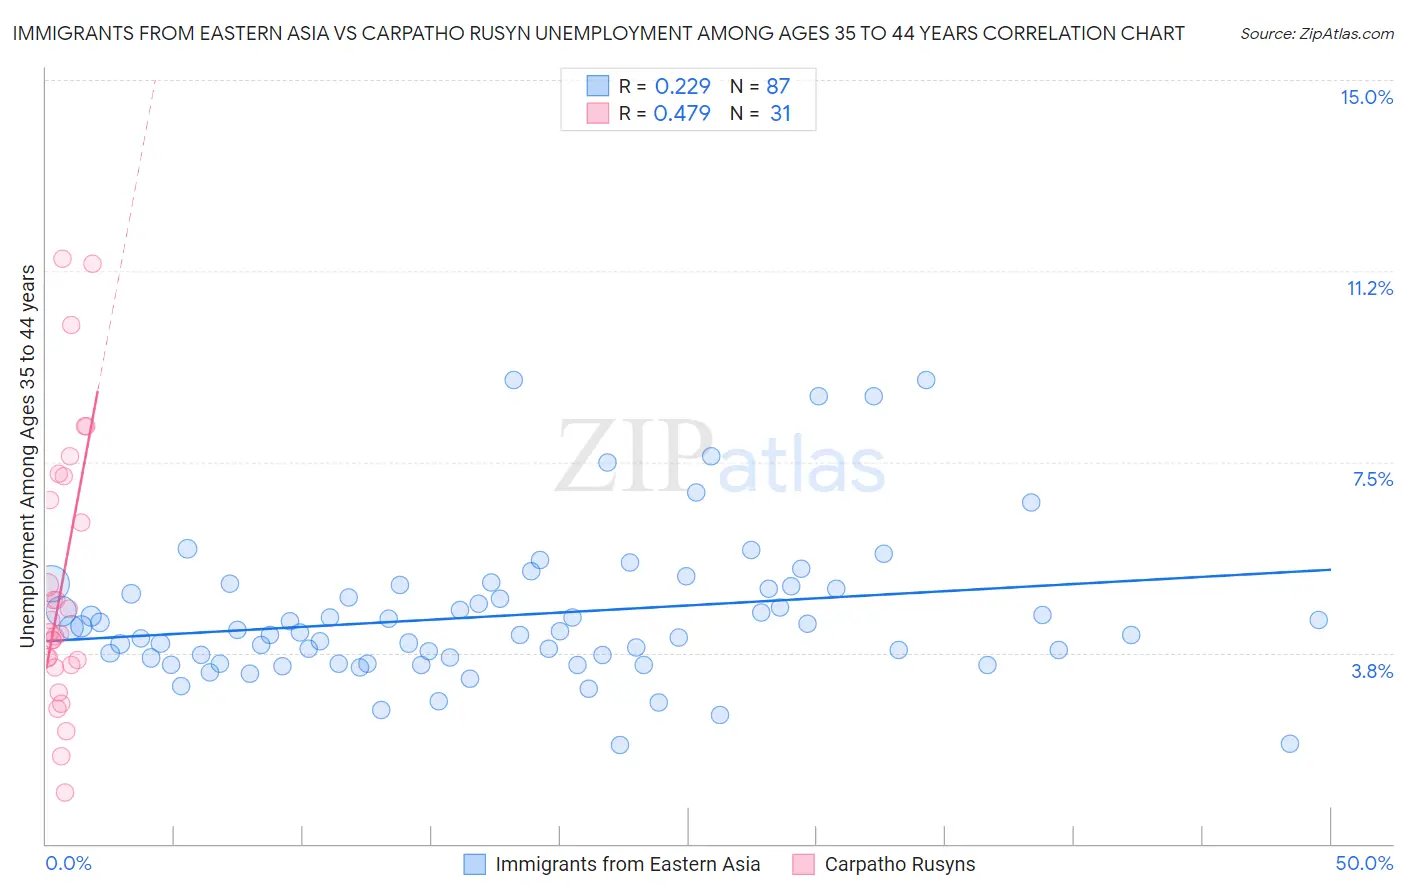
Immigrants from Eastern Asia vs Carpatho Rusyn Unemployment Among Ages 35 to 44 years Correlation Chart
The statistical analysis conducted on geographies consisting of 481,023,005 people shows a weak positive correlation between the proportion of Immigrants from Eastern Asia and unemployment rate among population between the ages 35 and 44 in the United States with a correlation coefficient (R) of 0.229 and weighted average of 4.4%. Similarly, the statistical analysis conducted on geographies consisting of 58,444,896 people shows a moderate positive correlation between the proportion of Carpatho Rusyns and unemployment rate among population between the ages 35 and 44 in the United States with a correlation coefficient (R) of 0.479 and weighted average of 4.3%, a difference of 1.9%.
Unemployment Among Ages 35 to 44 years Correlation Summary
| Measurement | Immigrants from Eastern Asia | Carpatho Rusyn |
| Minimum | 1.9% | 1.0% |
| Maximum | 9.1% | 11.5% |
| Range | 7.2% | 10.5% |
| Mean | 4.5% | 5.2% |
| Median | 4.2% | 4.2% |
| Interquartile 25% (IQ1) | 3.6% | 3.5% |
| Interquartile 75% (IQ3) | 5.0% | 7.2% |
| Interquartile Range (IQR) | 1.4% | 3.7% |
| Standard Deviation (Sample) | 1.4% | 2.7% |
| Standard Deviation (Population) | 1.4% | 2.6% |
Demographics Similar to Immigrants from Eastern Asia and Carpatho Rusyns by Unemployment Among Ages 35 to 44 years
In terms of unemployment among ages 35 to 44 years, the demographic groups most similar to Immigrants from Eastern Asia are Immigrants from Turkey (4.4%, a difference of 0.020%), Swiss (4.4%, a difference of 0.42%), Bhutanese (4.4%, a difference of 0.43%), British (4.4%, a difference of 0.52%), and Immigrants from Korea (4.3%, a difference of 0.67%). Similarly, the demographic groups most similar to Carpatho Rusyns are Chinese (4.3%, a difference of 0.10%), Immigrants from Sri Lanka (4.3%, a difference of 0.20%), Jordanian (4.3%, a difference of 0.35%), Luxembourger (4.3%, a difference of 0.39%), and Mongolian (4.3%, a difference of 0.49%).
| Demographics | Rating | Rank | Unemployment Among Ages 35 to 44 years |
| Carpatho Rusyns | 99.2 /100 | #31 | Exceptional 4.3% |
| Chinese | 99.1 /100 | #32 | Exceptional 4.3% |
| Immigrants | Sri Lanka | 99.1 /100 | #33 | Exceptional 4.3% |
| Jordanians | 99.0 /100 | #34 | Exceptional 4.3% |
| Luxembourgers | 99.0 /100 | #35 | Exceptional 4.3% |
| Mongolians | 98.9 /100 | #36 | Exceptional 4.3% |
| Immigrants | Zimbabwe | 98.9 /100 | #37 | Exceptional 4.3% |
| Burmese | 98.9 /100 | #38 | Exceptional 4.3% |
| Palestinians | 98.8 /100 | #39 | Exceptional 4.3% |
| Zimbabweans | 98.8 /100 | #40 | Exceptional 4.3% |
| Belgians | 98.7 /100 | #41 | Exceptional 4.3% |
| Germans | 98.7 /100 | #42 | Exceptional 4.3% |
| Eastern Europeans | 98.7 /100 | #43 | Exceptional 4.3% |
| Immigrants | Malaysia | 98.7 /100 | #44 | Exceptional 4.3% |
| Immigrants | Korea | 98.4 /100 | #45 | Exceptional 4.3% |
| Immigrants | Belgium | 98.4 /100 | #46 | Exceptional 4.3% |
| British | 98.3 /100 | #47 | Exceptional 4.4% |
| Bhutanese | 98.2 /100 | #48 | Exceptional 4.4% |
| Swiss | 98.2 /100 | #49 | Exceptional 4.4% |
| Immigrants | Turkey | 97.8 /100 | #50 | Exceptional 4.4% |
| Immigrants | Eastern Asia | 97.8 /100 | #51 | Exceptional 4.4% |