Immigrants from Eastern Asia vs Immigrants from Burma/Myanmar 3rd Grade
COMPARE
Immigrants from Eastern Asia
Immigrants from Burma/Myanmar
3rd Grade
3rd Grade Comparison
Immigrants from Eastern Asia
Immigrants from Burma/Myanmar
97.4%
3RD GRADE
1.9/ 100
METRIC RATING
234th/ 347
METRIC RANK
96.6%
3RD GRADE
0.0/ 100
METRIC RATING
316th/ 347
METRIC RANK
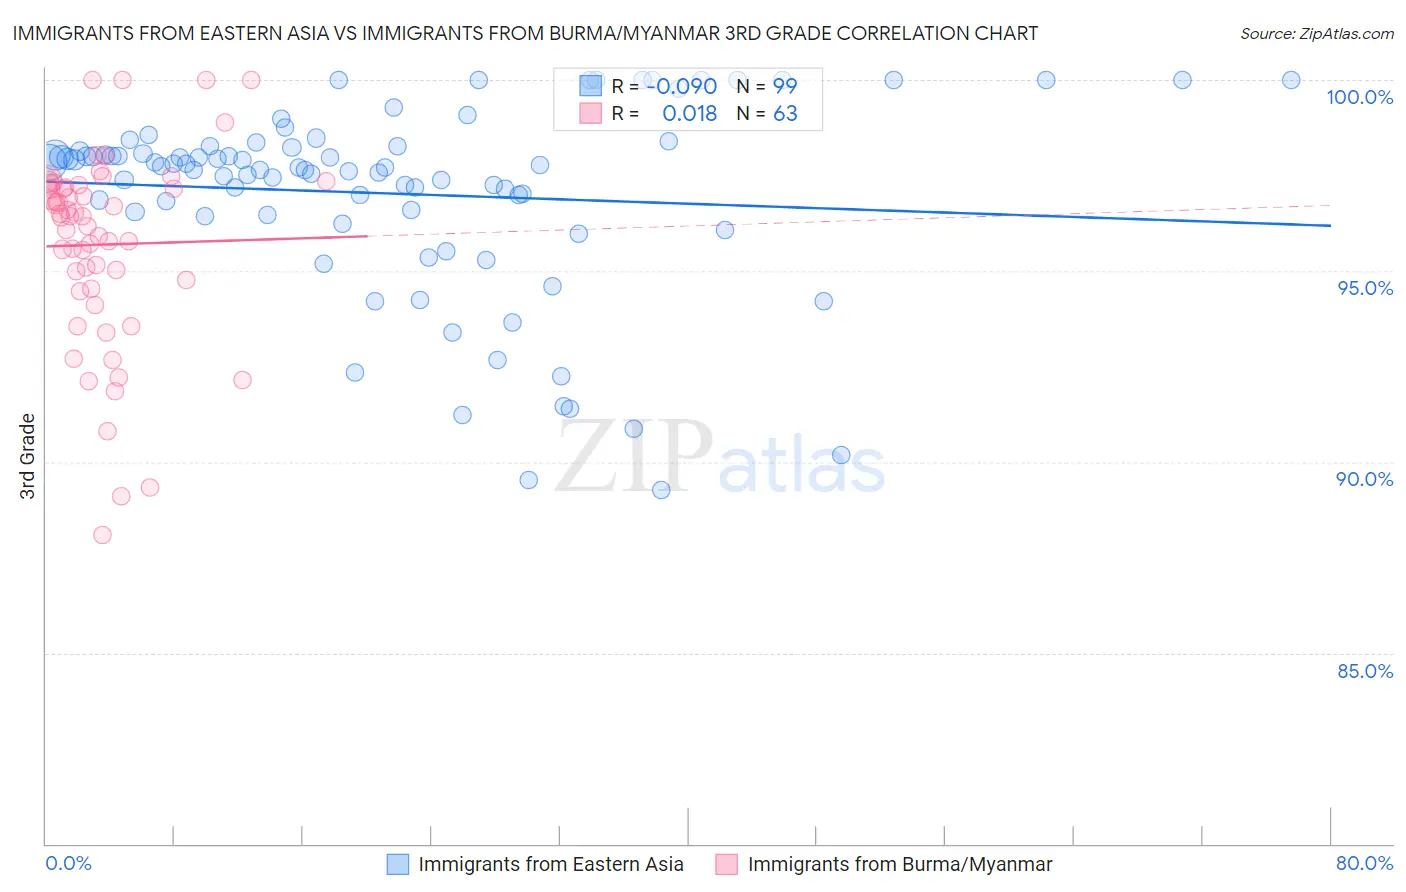
Immigrants from Eastern Asia vs Immigrants from Burma/Myanmar 3rd Grade Correlation Chart
The statistical analysis conducted on geographies consisting of 499,865,893 people shows a slight negative correlation between the proportion of Immigrants from Eastern Asia and percentage of population with at least 3rd grade education in the United States with a correlation coefficient (R) of -0.090 and weighted average of 97.4%. Similarly, the statistical analysis conducted on geographies consisting of 172,338,093 people shows no correlation between the proportion of Immigrants from Burma/Myanmar and percentage of population with at least 3rd grade education in the United States with a correlation coefficient (R) of 0.018 and weighted average of 96.6%, a difference of 0.89%.
3rd Grade Correlation Summary
| Measurement | Immigrants from Eastern Asia | Immigrants from Burma/Myanmar |
| Minimum | 89.3% | 88.1% |
| Maximum | 100.0% | 100.0% |
| Range | 10.7% | 11.9% |
| Mean | 97.0% | 95.7% |
| Median | 97.7% | 96.4% |
| Interquartile 25% (IQ1) | 96.5% | 94.5% |
| Interquartile 75% (IQ3) | 98.3% | 97.3% |
| Interquartile Range (IQR) | 1.8% | 2.7% |
| Standard Deviation (Sample) | 2.5% | 2.5% |
| Standard Deviation (Population) | 2.5% | 2.5% |
Similar Demographics by 3rd Grade
Demographics Similar to Immigrants from Eastern Asia by 3rd Grade
In terms of 3rd grade, the demographic groups most similar to Immigrants from Eastern Asia are Immigrants from Iraq (97.4%, a difference of 0.010%), Liberian (97.4%, a difference of 0.010%), Colombian (97.4%, a difference of 0.010%), Immigrants from Uruguay (97.4%, a difference of 0.010%), and Immigrants from Western Asia (97.5%, a difference of 0.020%).
| Demographics | Rating | Rank | 3rd Grade |
| Immigrants | Sudan | 3.4 /100 | #227 | Tragic 97.5% |
| Sub-Saharan Africans | 3.2 /100 | #228 | Tragic 97.5% |
| Senegalese | 3.0 /100 | #229 | Tragic 97.5% |
| Immigrants | Pakistan | 2.7 /100 | #230 | Tragic 97.5% |
| Immigrants | Costa Rica | 2.7 /100 | #231 | Tragic 97.5% |
| Immigrants | Western Asia | 2.6 /100 | #232 | Tragic 97.5% |
| Immigrants | Malaysia | 2.4 /100 | #233 | Tragic 97.5% |
| Immigrants | Eastern Asia | 1.9 /100 | #234 | Tragic 97.4% |
| Immigrants | Iraq | 1.8 /100 | #235 | Tragic 97.4% |
| Liberians | 1.8 /100 | #236 | Tragic 97.4% |
| Colombians | 1.8 /100 | #237 | Tragic 97.4% |
| Immigrants | Uruguay | 1.7 /100 | #238 | Tragic 97.4% |
| Nigerians | 1.6 /100 | #239 | Tragic 97.4% |
| U.S. Virgin Islanders | 1.4 /100 | #240 | Tragic 97.4% |
| Immigrants | Indonesia | 1.4 /100 | #241 | Tragic 97.4% |
Demographics Similar to Immigrants from Burma/Myanmar by 3rd Grade
In terms of 3rd grade, the demographic groups most similar to Immigrants from Burma/Myanmar are Immigrants from the Azores (96.6%, a difference of 0.010%), Immigrants from Ecuador (96.6%, a difference of 0.020%), Belizean (96.6%, a difference of 0.020%), Immigrants from Bangladesh (96.6%, a difference of 0.020%), and Immigrants from Laos (96.6%, a difference of 0.030%).
| Demographics | Rating | Rank | 3rd Grade |
| Sri Lankans | 0.0 /100 | #309 | Tragic 96.7% |
| Cape Verdeans | 0.0 /100 | #310 | Tragic 96.6% |
| Immigrants | Guyana | 0.0 /100 | #311 | Tragic 96.6% |
| Immigrants | Laos | 0.0 /100 | #312 | Tragic 96.6% |
| Immigrants | Ecuador | 0.0 /100 | #313 | Tragic 96.6% |
| Belizeans | 0.0 /100 | #314 | Tragic 96.6% |
| Immigrants | Azores | 0.0 /100 | #315 | Tragic 96.6% |
| Immigrants | Burma/Myanmar | 0.0 /100 | #316 | Tragic 96.6% |
| Immigrants | Bangladesh | 0.0 /100 | #317 | Tragic 96.6% |
| Hispanics or Latinos | 0.0 /100 | #318 | Tragic 96.5% |
| Vietnamese | 0.0 /100 | #319 | Tragic 96.5% |
| Immigrants | Nicaragua | 0.0 /100 | #320 | Tragic 96.5% |
| Indonesians | 0.0 /100 | #321 | Tragic 96.5% |
| Immigrants | Belize | 0.0 /100 | #322 | Tragic 96.5% |
| Hondurans | 0.0 /100 | #323 | Tragic 96.5% |