Subsaharan African vs Immigrants from Burma/Myanmar Unemployment Among Ages 35 to 44 years
COMPARE
Subsaharan African
Immigrants from Burma/Myanmar
Unemployment Among Ages 35 to 44 years
Unemployment Among Ages 35 to 44 years Comparison
Sub-Saharan Africans
Immigrants from Burma/Myanmar
5.3%
UNEMPLOYMENT AMONG AGES 35 TO 44 YEARS
0.1/ 100
METRIC RATING
260th/ 347
METRIC RANK
4.6%
UNEMPLOYMENT AMONG AGES 35 TO 44 YEARS
72.2/ 100
METRIC RATING
149th/ 347
METRIC RANK
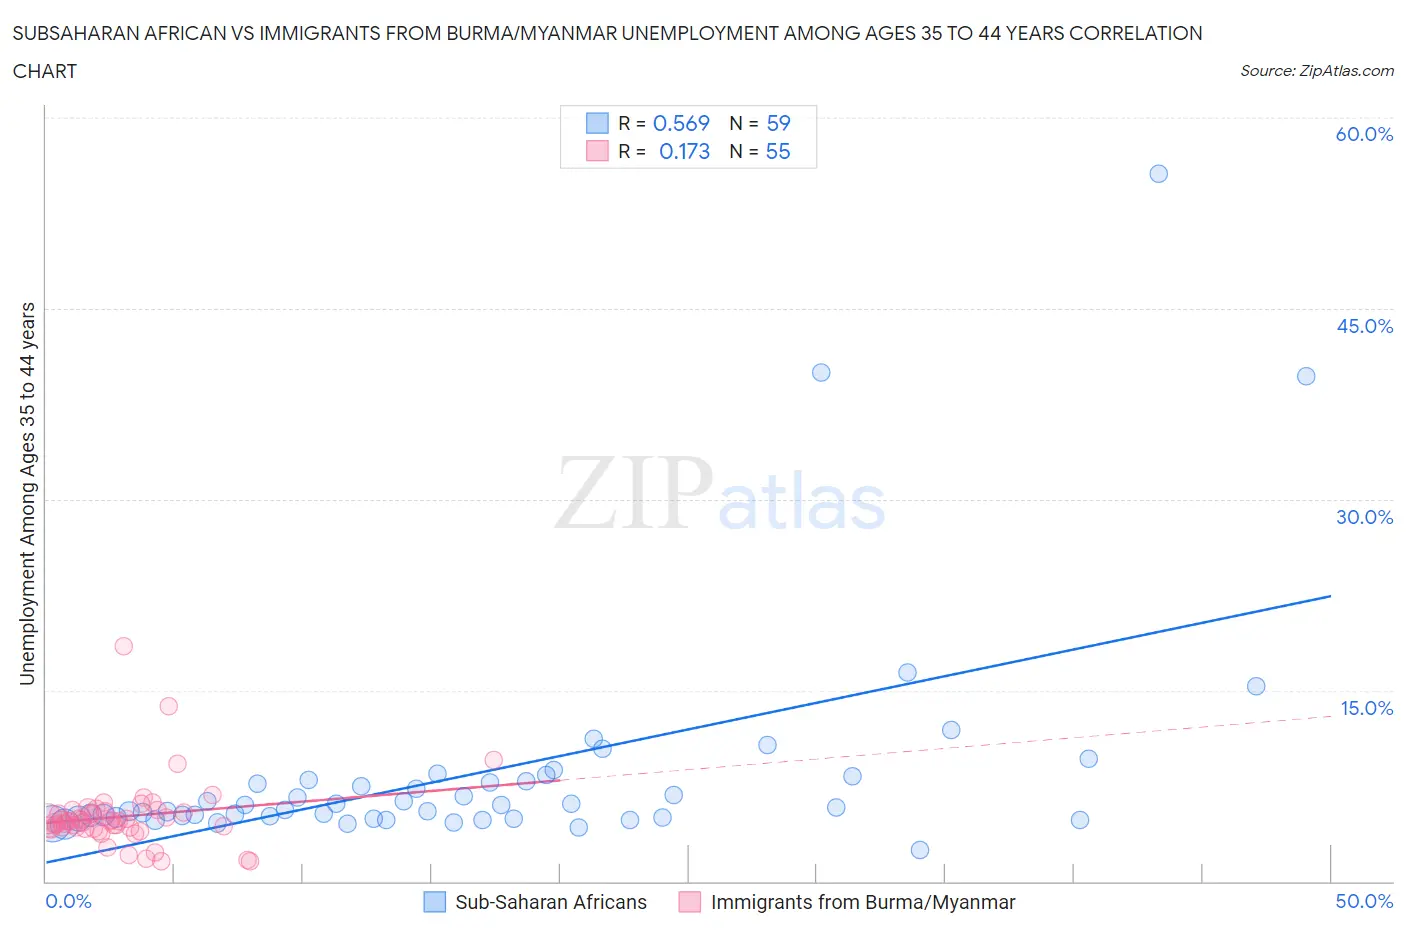
Subsaharan African vs Immigrants from Burma/Myanmar Unemployment Among Ages 35 to 44 years Correlation Chart
The statistical analysis conducted on geographies consisting of 489,916,914 people shows a substantial positive correlation between the proportion of Sub-Saharan Africans and unemployment rate among population between the ages 35 and 44 in the United States with a correlation coefficient (R) of 0.569 and weighted average of 5.3%. Similarly, the statistical analysis conducted on geographies consisting of 171,415,766 people shows a poor positive correlation between the proportion of Immigrants from Burma/Myanmar and unemployment rate among population between the ages 35 and 44 in the United States with a correlation coefficient (R) of 0.173 and weighted average of 4.6%, a difference of 14.3%.
Unemployment Among Ages 35 to 44 years Correlation Summary
| Measurement | Subsaharan African | Immigrants from Burma/Myanmar |
| Minimum | 2.5% | 1.6% |
| Maximum | 55.6% | 18.5% |
| Range | 53.1% | 16.9% |
| Mean | 8.6% | 5.1% |
| Median | 5.8% | 4.7% |
| Interquartile 25% (IQ1) | 4.9% | 4.2% |
| Interquartile 75% (IQ3) | 7.9% | 5.5% |
| Interquartile Range (IQR) | 3.0% | 1.3% |
| Standard Deviation (Sample) | 9.1% | 2.7% |
| Standard Deviation (Population) | 9.0% | 2.7% |
Similar Demographics by Unemployment Among Ages 35 to 44 years
Demographics Similar to Sub-Saharan Africans by Unemployment Among Ages 35 to 44 years
In terms of unemployment among ages 35 to 44 years, the demographic groups most similar to Sub-Saharan Africans are Mexican (5.3%, a difference of 0.030%), Immigrants from Latin America (5.3%, a difference of 0.13%), Spanish American (5.3%, a difference of 0.20%), Immigrants from Fiji (5.3%, a difference of 0.25%), and Seminole (5.2%, a difference of 0.53%).
| Demographics | Rating | Rank | Unemployment Among Ages 35 to 44 years |
| Mexican American Indians | 0.2 /100 | #253 | Tragic 5.2% |
| Immigrants | Bahamas | 0.2 /100 | #254 | Tragic 5.2% |
| Cherokee | 0.2 /100 | #255 | Tragic 5.2% |
| Seminole | 0.1 /100 | #256 | Tragic 5.2% |
| Immigrants | Fiji | 0.1 /100 | #257 | Tragic 5.3% |
| Immigrants | Latin America | 0.1 /100 | #258 | Tragic 5.3% |
| Mexicans | 0.1 /100 | #259 | Tragic 5.3% |
| Sub-Saharan Africans | 0.1 /100 | #260 | Tragic 5.3% |
| Spanish Americans | 0.1 /100 | #261 | Tragic 5.3% |
| Immigrants | Central America | 0.1 /100 | #262 | Tragic 5.3% |
| Choctaw | 0.1 /100 | #263 | Tragic 5.3% |
| Ghanaians | 0.1 /100 | #264 | Tragic 5.3% |
| Yaqui | 0.1 /100 | #265 | Tragic 5.3% |
| Immigrants | Bangladesh | 0.1 /100 | #266 | Tragic 5.3% |
| Immigrants | Western Africa | 0.0 /100 | #267 | Tragic 5.3% |
Demographics Similar to Immigrants from Burma/Myanmar by Unemployment Among Ages 35 to 44 years
In terms of unemployment among ages 35 to 44 years, the demographic groups most similar to Immigrants from Burma/Myanmar are Slavic (4.6%, a difference of 0.020%), Immigrants from Vietnam (4.6%, a difference of 0.14%), Immigrants from England (4.6%, a difference of 0.15%), Immigrants from Denmark (4.6%, a difference of 0.20%), and Immigrants from Eastern Europe (4.6%, a difference of 0.23%).
| Demographics | Rating | Rank | Unemployment Among Ages 35 to 44 years |
| Ukrainians | 75.8 /100 | #142 | Good 4.6% |
| Immigrants | Switzerland | 75.5 /100 | #143 | Good 4.6% |
| Immigrants | Russia | 75.4 /100 | #144 | Good 4.6% |
| Immigrants | Eastern Europe | 74.7 /100 | #145 | Good 4.6% |
| Immigrants | Denmark | 74.4 /100 | #146 | Good 4.6% |
| Immigrants | Vietnam | 73.8 /100 | #147 | Good 4.6% |
| Slavs | 72.4 /100 | #148 | Good 4.6% |
| Immigrants | Burma/Myanmar | 72.2 /100 | #149 | Good 4.6% |
| Immigrants | England | 70.5 /100 | #150 | Good 4.6% |
| Puget Sound Salish | 67.1 /100 | #151 | Good 4.6% |
| Pakistanis | 67.1 /100 | #152 | Good 4.6% |
| Immigrants | Brazil | 67.0 /100 | #153 | Good 4.6% |
| Immigrants | Western Europe | 65.5 /100 | #154 | Good 4.6% |
| Whites/Caucasians | 64.9 /100 | #155 | Good 4.6% |
| South Americans | 63.7 /100 | #156 | Good 4.6% |