Immigrants from Eastern Asia vs Immigrants from Lithuania Unemployment Among Ages 35 to 44 years
COMPARE
Immigrants from Eastern Asia
Immigrants from Lithuania
Unemployment Among Ages 35 to 44 years
Unemployment Among Ages 35 to 44 years Comparison
Immigrants from Eastern Asia
Immigrants from Lithuania
4.4%
UNEMPLOYMENT AMONG AGES 35 TO 44 YEARS
97.8/ 100
METRIC RATING
51st/ 347
METRIC RANK
4.4%
UNEMPLOYMENT AMONG AGES 35 TO 44 YEARS
96.7/ 100
METRIC RATING
71st/ 347
METRIC RANK
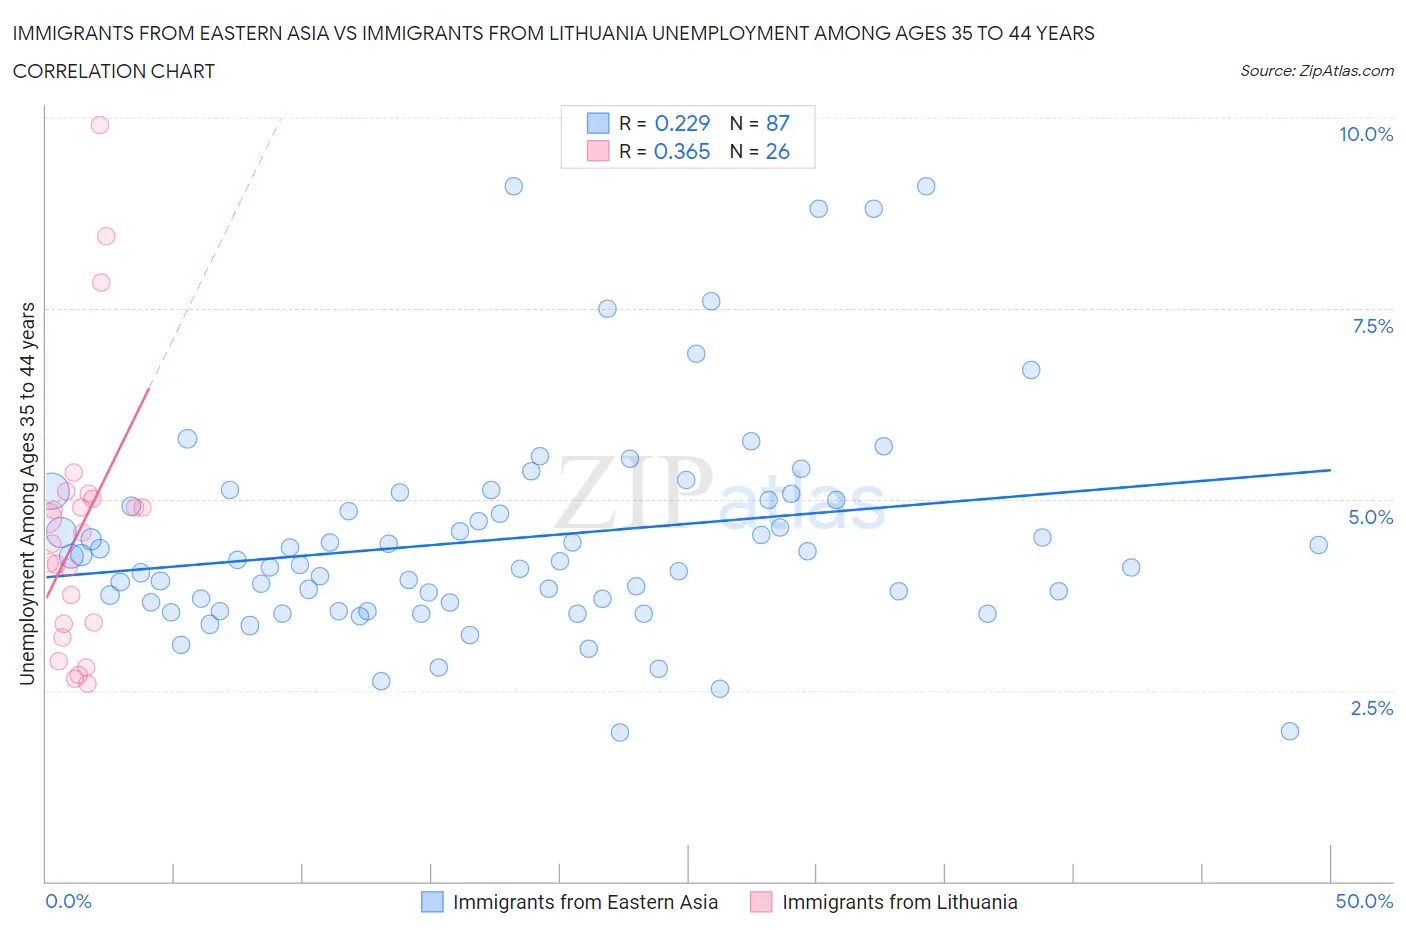
Immigrants from Eastern Asia vs Immigrants from Lithuania Unemployment Among Ages 35 to 44 years Correlation Chart
The statistical analysis conducted on geographies consisting of 481,023,005 people shows a weak positive correlation between the proportion of Immigrants from Eastern Asia and unemployment rate among population between the ages 35 and 44 in the United States with a correlation coefficient (R) of 0.229 and weighted average of 4.4%. Similarly, the statistical analysis conducted on geographies consisting of 116,771,624 people shows a mild positive correlation between the proportion of Immigrants from Lithuania and unemployment rate among population between the ages 35 and 44 in the United States with a correlation coefficient (R) of 0.365 and weighted average of 4.4%, a difference of 0.75%.
Unemployment Among Ages 35 to 44 years Correlation Summary
| Measurement | Immigrants from Eastern Asia | Immigrants from Lithuania |
| Minimum | 1.9% | 2.6% |
| Maximum | 9.1% | 9.9% |
| Range | 7.2% | 7.3% |
| Mean | 4.5% | 4.6% |
| Median | 4.2% | 4.5% |
| Interquartile 25% (IQ1) | 3.6% | 3.4% |
| Interquartile 75% (IQ3) | 5.0% | 5.0% |
| Interquartile Range (IQR) | 1.4% | 1.6% |
| Standard Deviation (Sample) | 1.4% | 1.8% |
| Standard Deviation (Population) | 1.4% | 1.7% |
Demographics Similar to Immigrants from Eastern Asia and Immigrants from Lithuania by Unemployment Among Ages 35 to 44 years
In terms of unemployment among ages 35 to 44 years, the demographic groups most similar to Immigrants from Eastern Asia are Okinawan (4.4%, a difference of 0.020%), Immigrants from Argentina (4.4%, a difference of 0.16%), Asian (4.4%, a difference of 0.32%), Immigrants from Moldova (4.4%, a difference of 0.35%), and Chilean (4.4%, a difference of 0.37%). Similarly, the demographic groups most similar to Immigrants from Lithuania are Slovene (4.4%, a difference of 0.0%), Immigrants from China (4.4%, a difference of 0.0%), Argentinean (4.4%, a difference of 0.070%), Immigrants from Ireland (4.4%, a difference of 0.070%), and Icelander (4.4%, a difference of 0.080%).
| Demographics | Rating | Rank | Unemployment Among Ages 35 to 44 years |
| Immigrants | Eastern Asia | 97.8 /100 | #51 | Exceptional 4.4% |
| Okinawans | 97.7 /100 | #52 | Exceptional 4.4% |
| Immigrants | Argentina | 97.6 /100 | #53 | Exceptional 4.4% |
| Asians | 97.4 /100 | #54 | Exceptional 4.4% |
| Immigrants | Moldova | 97.3 /100 | #55 | Exceptional 4.4% |
| Chileans | 97.3 /100 | #56 | Exceptional 4.4% |
| Immigrants | Hong Kong | 97.2 /100 | #57 | Exceptional 4.4% |
| English | 97.2 /100 | #58 | Exceptional 4.4% |
| Greeks | 97.1 /100 | #59 | Exceptional 4.4% |
| Taiwanese | 97.1 /100 | #60 | Exceptional 4.4% |
| Croatians | 97.1 /100 | #61 | Exceptional 4.4% |
| Immigrants | Bulgaria | 97.1 /100 | #62 | Exceptional 4.4% |
| Austrians | 97.1 /100 | #63 | Exceptional 4.4% |
| Immigrants | Serbia | 97.0 /100 | #64 | Exceptional 4.4% |
| Cambodians | 97.0 /100 | #65 | Exceptional 4.4% |
| Icelanders | 96.8 /100 | #66 | Exceptional 4.4% |
| Argentineans | 96.8 /100 | #67 | Exceptional 4.4% |
| Immigrants | Ireland | 96.8 /100 | #68 | Exceptional 4.4% |
| Slovenes | 96.7 /100 | #69 | Exceptional 4.4% |
| Immigrants | China | 96.7 /100 | #70 | Exceptional 4.4% |
| Immigrants | Lithuania | 96.7 /100 | #71 | Exceptional 4.4% |