Immigrants from Dominica vs Thai Unemployment Among Women with Children Ages 6 to 17 years
COMPARE
Immigrants from Dominica
Thai
Unemployment Among Women with Children Ages 6 to 17 years
Unemployment Among Women with Children Ages 6 to 17 years Comparison
Immigrants from Dominica
Thais
10.5%
UNEMPLOYMENT AMONG WOMEN WITH CHILDREN AGES 6 TO 17 YEARS
0.0/ 100
METRIC RATING
316th/ 347
METRIC RANK
7.8%
UNEMPLOYMENT AMONG WOMEN WITH CHILDREN AGES 6 TO 17 YEARS
100.0/ 100
METRIC RATING
29th/ 347
METRIC RANK
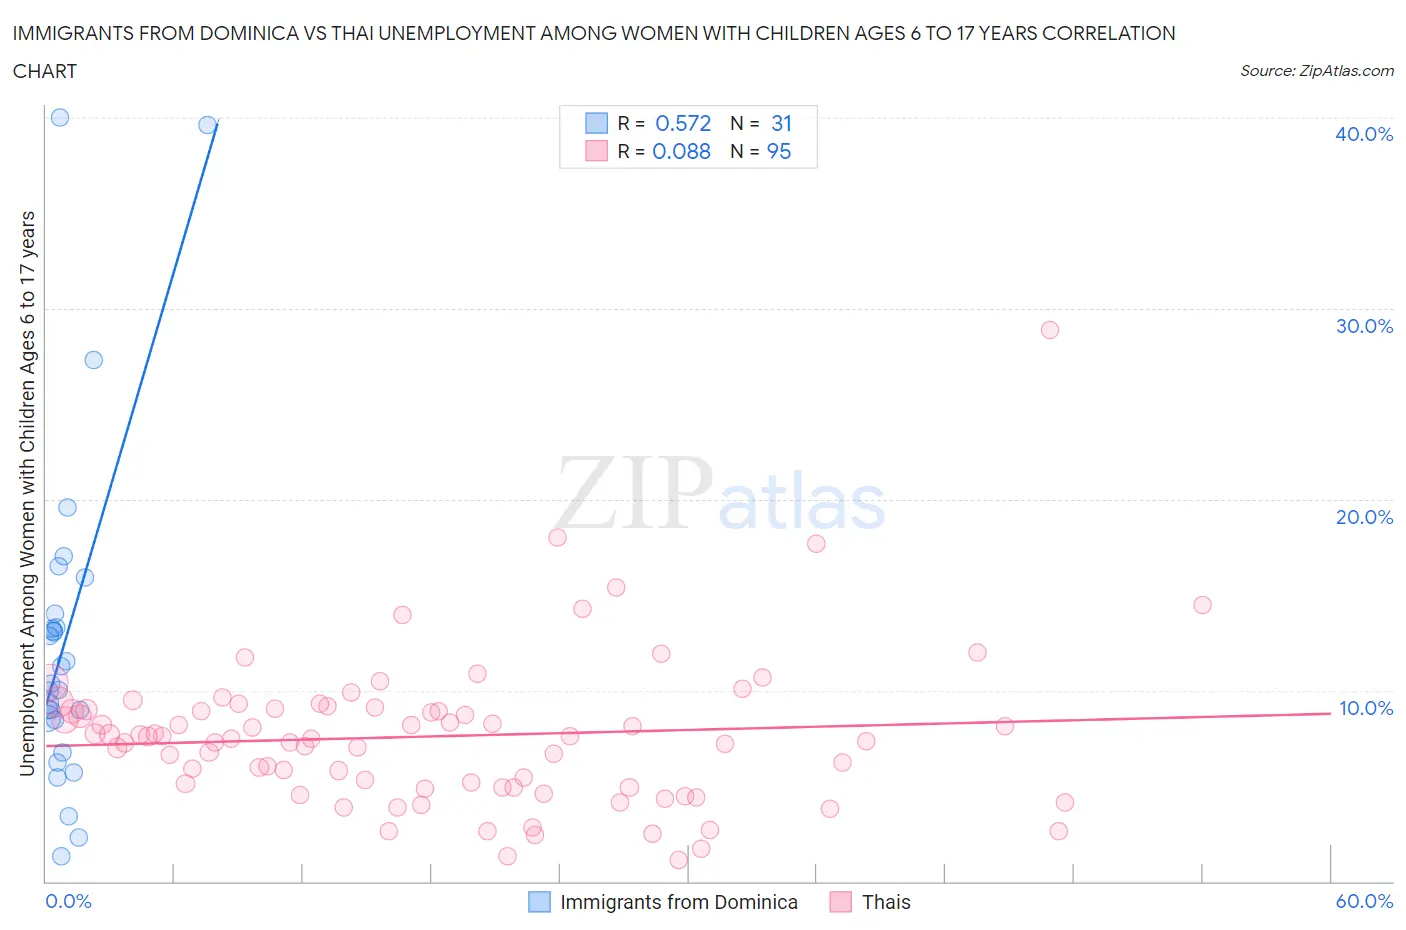
Immigrants from Dominica vs Thai Unemployment Among Women with Children Ages 6 to 17 years Correlation Chart
The statistical analysis conducted on geographies consisting of 74,932,264 people shows a substantial positive correlation between the proportion of Immigrants from Dominica and unemployment rate among women with children between the ages 6 and 17 in the United States with a correlation coefficient (R) of 0.572 and weighted average of 10.5%. Similarly, the statistical analysis conducted on geographies consisting of 328,573,695 people shows a slight positive correlation between the proportion of Thais and unemployment rate among women with children between the ages 6 and 17 in the United States with a correlation coefficient (R) of 0.088 and weighted average of 7.8%, a difference of 34.2%.
Unemployment Among Women with Children Ages 6 to 17 years Correlation Summary
| Measurement | Immigrants from Dominica | Thai |
| Minimum | 1.3% | 1.1% |
| Maximum | 40.0% | 28.9% |
| Range | 38.7% | 27.8% |
| Mean | 12.7% | 7.6% |
| Median | 10.3% | 7.5% |
| Interquartile 25% (IQ1) | 8.5% | 4.9% |
| Interquartile 75% (IQ3) | 14.0% | 9.0% |
| Interquartile Range (IQR) | 5.5% | 4.1% |
| Standard Deviation (Sample) | 8.9% | 4.0% |
| Standard Deviation (Population) | 8.8% | 4.0% |
Similar Demographics by Unemployment Among Women with Children Ages 6 to 17 years
Demographics Similar to Immigrants from Dominica by Unemployment Among Women with Children Ages 6 to 17 years
In terms of unemployment among women with children ages 6 to 17 years, the demographic groups most similar to Immigrants from Dominica are Bermudan (10.5%, a difference of 0.12%), Delaware (10.5%, a difference of 0.13%), Bahamian (10.4%, a difference of 0.75%), Immigrants from Cabo Verde (10.4%, a difference of 0.78%), and American (10.4%, a difference of 0.83%).
| Demographics | Rating | Rank | Unemployment Among Women with Children Ages 6 to 17 years |
| French Canadians | 0.0 /100 | #309 | Tragic 10.3% |
| Alaska Natives | 0.0 /100 | #310 | Tragic 10.3% |
| Immigrants | Liberia | 0.0 /100 | #311 | Tragic 10.3% |
| Africans | 0.0 /100 | #312 | Tragic 10.4% |
| Americans | 0.0 /100 | #313 | Tragic 10.4% |
| Immigrants | Cabo Verde | 0.0 /100 | #314 | Tragic 10.4% |
| Bahamians | 0.0 /100 | #315 | Tragic 10.4% |
| Immigrants | Dominica | 0.0 /100 | #316 | Tragic 10.5% |
| Bermudans | 0.0 /100 | #317 | Tragic 10.5% |
| Delaware | 0.0 /100 | #318 | Tragic 10.5% |
| Immigrants | Uganda | 0.0 /100 | #319 | Tragic 10.7% |
| Apache | 0.0 /100 | #320 | Tragic 10.7% |
| Tohono O'odham | 0.0 /100 | #321 | Tragic 10.7% |
| Cree | 0.0 /100 | #322 | Tragic 10.8% |
| Dominicans | 0.0 /100 | #323 | Tragic 10.8% |
Demographics Similar to Thais by Unemployment Among Women with Children Ages 6 to 17 years
In terms of unemployment among women with children ages 6 to 17 years, the demographic groups most similar to Thais are Immigrants from Uzbekistan (7.8%, a difference of 0.34%), Immigrants from Afghanistan (7.8%, a difference of 0.67%), Immigrants from Iran (7.9%, a difference of 0.89%), Laotian (7.9%, a difference of 1.1%), and Immigrants from Cambodia (7.9%, a difference of 1.1%).
| Demographics | Rating | Rank | Unemployment Among Women with Children Ages 6 to 17 years |
| Immigrants | China | 100.0 /100 | #22 | Exceptional 7.7% |
| Immigrants | Indonesia | 100.0 /100 | #23 | Exceptional 7.7% |
| Nepalese | 100.0 /100 | #24 | Exceptional 7.7% |
| Immigrants | Eastern Asia | 100.0 /100 | #25 | Exceptional 7.7% |
| Indians (Asian) | 100.0 /100 | #26 | Exceptional 7.7% |
| Immigrants | Afghanistan | 100.0 /100 | #27 | Exceptional 7.8% |
| Immigrants | Uzbekistan | 100.0 /100 | #28 | Exceptional 7.8% |
| Thais | 100.0 /100 | #29 | Exceptional 7.8% |
| Immigrants | Iran | 100.0 /100 | #30 | Exceptional 7.9% |
| Laotians | 100.0 /100 | #31 | Exceptional 7.9% |
| Immigrants | Cambodia | 100.0 /100 | #32 | Exceptional 7.9% |
| Immigrants | Korea | 100.0 /100 | #33 | Exceptional 7.9% |
| Native Hawaiians | 100.0 /100 | #34 | Exceptional 7.9% |
| Immigrants | South Central Asia | 100.0 /100 | #35 | Exceptional 7.9% |
| Burmese | 100.0 /100 | #36 | Exceptional 8.0% |