Immigrants from Dominica vs Immigrants from Israel Unemployment Among Women with Children Ages 6 to 17 years
COMPARE
Immigrants from Dominica
Immigrants from Israel
Unemployment Among Women with Children Ages 6 to 17 years
Unemployment Among Women with Children Ages 6 to 17 years Comparison
Immigrants from Dominica
Immigrants from Israel
10.5%
UNEMPLOYMENT AMONG WOMEN WITH CHILDREN AGES 6 TO 17 YEARS
0.0/ 100
METRIC RATING
316th/ 347
METRIC RANK
8.5%
UNEMPLOYMENT AMONG WOMEN WITH CHILDREN AGES 6 TO 17 YEARS
99.1/ 100
METRIC RATING
87th/ 347
METRIC RANK
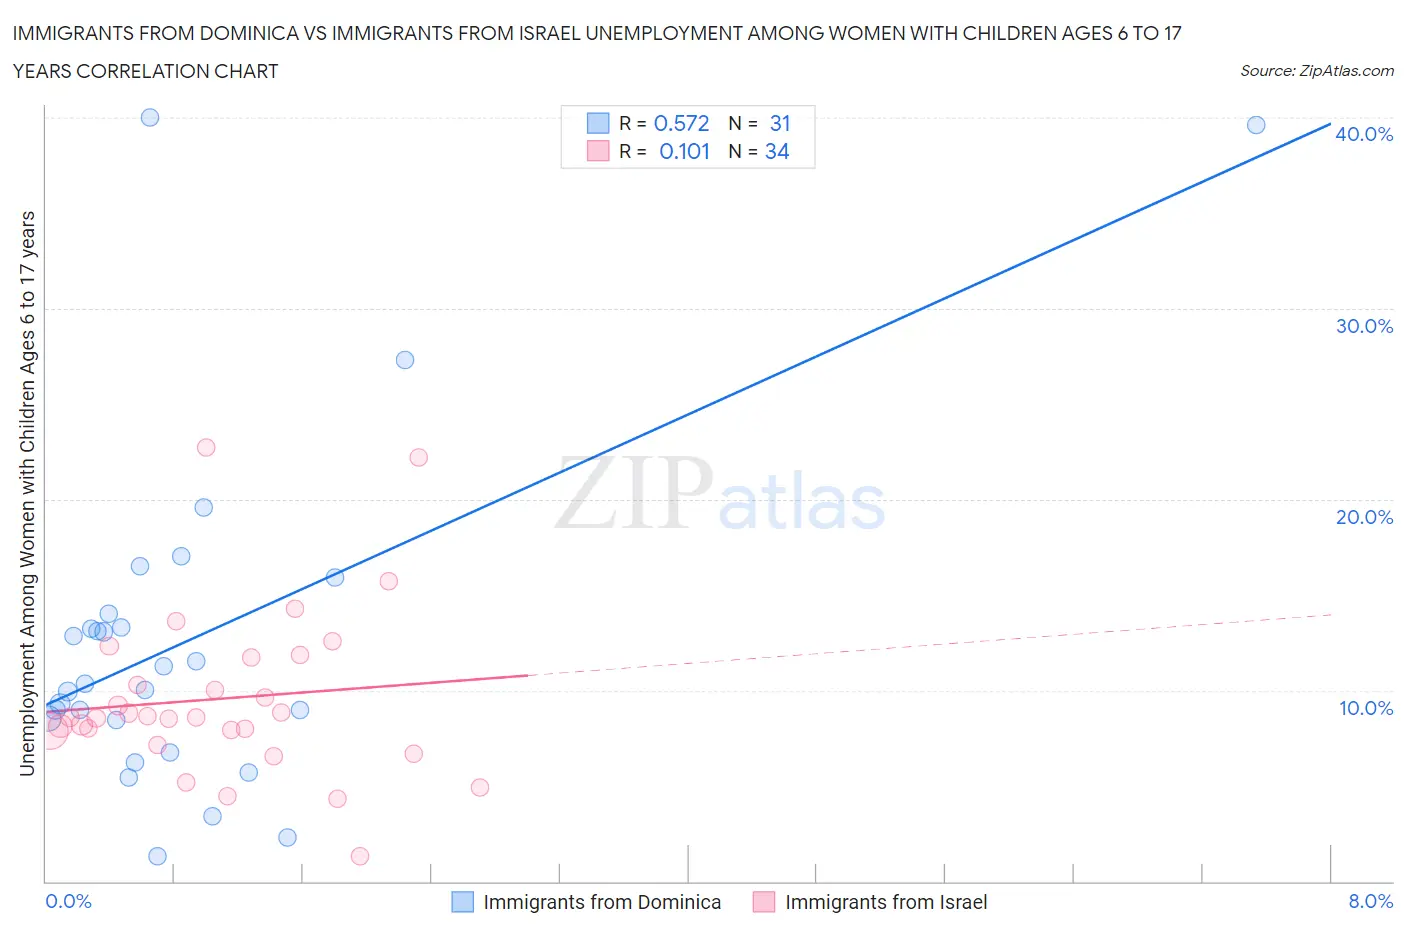
Immigrants from Dominica vs Immigrants from Israel Unemployment Among Women with Children Ages 6 to 17 years Correlation Chart
The statistical analysis conducted on geographies consisting of 74,932,264 people shows a substantial positive correlation between the proportion of Immigrants from Dominica and unemployment rate among women with children between the ages 6 and 17 in the United States with a correlation coefficient (R) of 0.572 and weighted average of 10.5%. Similarly, the statistical analysis conducted on geographies consisting of 166,050,756 people shows a poor positive correlation between the proportion of Immigrants from Israel and unemployment rate among women with children between the ages 6 and 17 in the United States with a correlation coefficient (R) of 0.101 and weighted average of 8.5%, a difference of 23.7%.
Unemployment Among Women with Children Ages 6 to 17 years Correlation Summary
| Measurement | Immigrants from Dominica | Immigrants from Israel |
| Minimum | 1.3% | 1.3% |
| Maximum | 40.0% | 22.7% |
| Range | 38.7% | 21.4% |
| Mean | 12.7% | 9.6% |
| Median | 10.3% | 8.6% |
| Interquartile 25% (IQ1) | 8.5% | 7.8% |
| Interquartile 75% (IQ3) | 14.0% | 11.7% |
| Interquartile Range (IQR) | 5.5% | 3.9% |
| Standard Deviation (Sample) | 8.9% | 4.4% |
| Standard Deviation (Population) | 8.8% | 4.3% |
Similar Demographics by Unemployment Among Women with Children Ages 6 to 17 years
Demographics Similar to Immigrants from Dominica by Unemployment Among Women with Children Ages 6 to 17 years
In terms of unemployment among women with children ages 6 to 17 years, the demographic groups most similar to Immigrants from Dominica are Bermudan (10.5%, a difference of 0.12%), Delaware (10.5%, a difference of 0.13%), Bahamian (10.4%, a difference of 0.75%), Immigrants from Cabo Verde (10.4%, a difference of 0.78%), and American (10.4%, a difference of 0.83%).
| Demographics | Rating | Rank | Unemployment Among Women with Children Ages 6 to 17 years |
| French Canadians | 0.0 /100 | #309 | Tragic 10.3% |
| Alaska Natives | 0.0 /100 | #310 | Tragic 10.3% |
| Immigrants | Liberia | 0.0 /100 | #311 | Tragic 10.3% |
| Africans | 0.0 /100 | #312 | Tragic 10.4% |
| Americans | 0.0 /100 | #313 | Tragic 10.4% |
| Immigrants | Cabo Verde | 0.0 /100 | #314 | Tragic 10.4% |
| Bahamians | 0.0 /100 | #315 | Tragic 10.4% |
| Immigrants | Dominica | 0.0 /100 | #316 | Tragic 10.5% |
| Bermudans | 0.0 /100 | #317 | Tragic 10.5% |
| Delaware | 0.0 /100 | #318 | Tragic 10.5% |
| Immigrants | Uganda | 0.0 /100 | #319 | Tragic 10.7% |
| Apache | 0.0 /100 | #320 | Tragic 10.7% |
| Tohono O'odham | 0.0 /100 | #321 | Tragic 10.7% |
| Cree | 0.0 /100 | #322 | Tragic 10.8% |
| Dominicans | 0.0 /100 | #323 | Tragic 10.8% |
Demographics Similar to Immigrants from Israel by Unemployment Among Women with Children Ages 6 to 17 years
In terms of unemployment among women with children ages 6 to 17 years, the demographic groups most similar to Immigrants from Israel are Immigrants from Vietnam (8.5%, a difference of 0.020%), Paiute (8.5%, a difference of 0.10%), Yugoslavian (8.5%, a difference of 0.13%), Immigrants from Eastern Europe (8.5%, a difference of 0.20%), and Potawatomi (8.5%, a difference of 0.22%).
| Demographics | Rating | Rank | Unemployment Among Women with Children Ages 6 to 17 years |
| Immigrants | Belarus | 99.6 /100 | #80 | Exceptional 8.4% |
| Immigrants | Bolivia | 99.6 /100 | #81 | Exceptional 8.4% |
| Cypriots | 99.6 /100 | #82 | Exceptional 8.4% |
| Bulgarians | 99.5 /100 | #83 | Exceptional 8.4% |
| Japanese | 99.5 /100 | #84 | Exceptional 8.4% |
| Immigrants | North Macedonia | 99.4 /100 | #85 | Exceptional 8.5% |
| Alaskan Athabascans | 99.4 /100 | #86 | Exceptional 8.5% |
| Immigrants | Israel | 99.1 /100 | #87 | Exceptional 8.5% |
| Immigrants | Vietnam | 99.1 /100 | #88 | Exceptional 8.5% |
| Paiute | 99.1 /100 | #89 | Exceptional 8.5% |
| Yugoslavians | 99.0 /100 | #90 | Exceptional 8.5% |
| Immigrants | Eastern Europe | 99.0 /100 | #91 | Exceptional 8.5% |
| Potawatomi | 99.0 /100 | #92 | Exceptional 8.5% |
| Australians | 98.9 /100 | #93 | Exceptional 8.5% |
| Immigrants | Barbados | 98.8 /100 | #94 | Exceptional 8.5% |