Mexican American Indian vs New Zealander Female Unemployment
COMPARE
Mexican American Indian
New Zealander
Female Unemployment
Female Unemployment Comparison
Mexican American Indians
New Zealanders
6.0%
FEMALE UNEMPLOYMENT
0.0/ 100
METRIC RATING
280th/ 347
METRIC RANK
5.0%
FEMALE UNEMPLOYMENT
97.4/ 100
METRIC RATING
80th/ 347
METRIC RANK
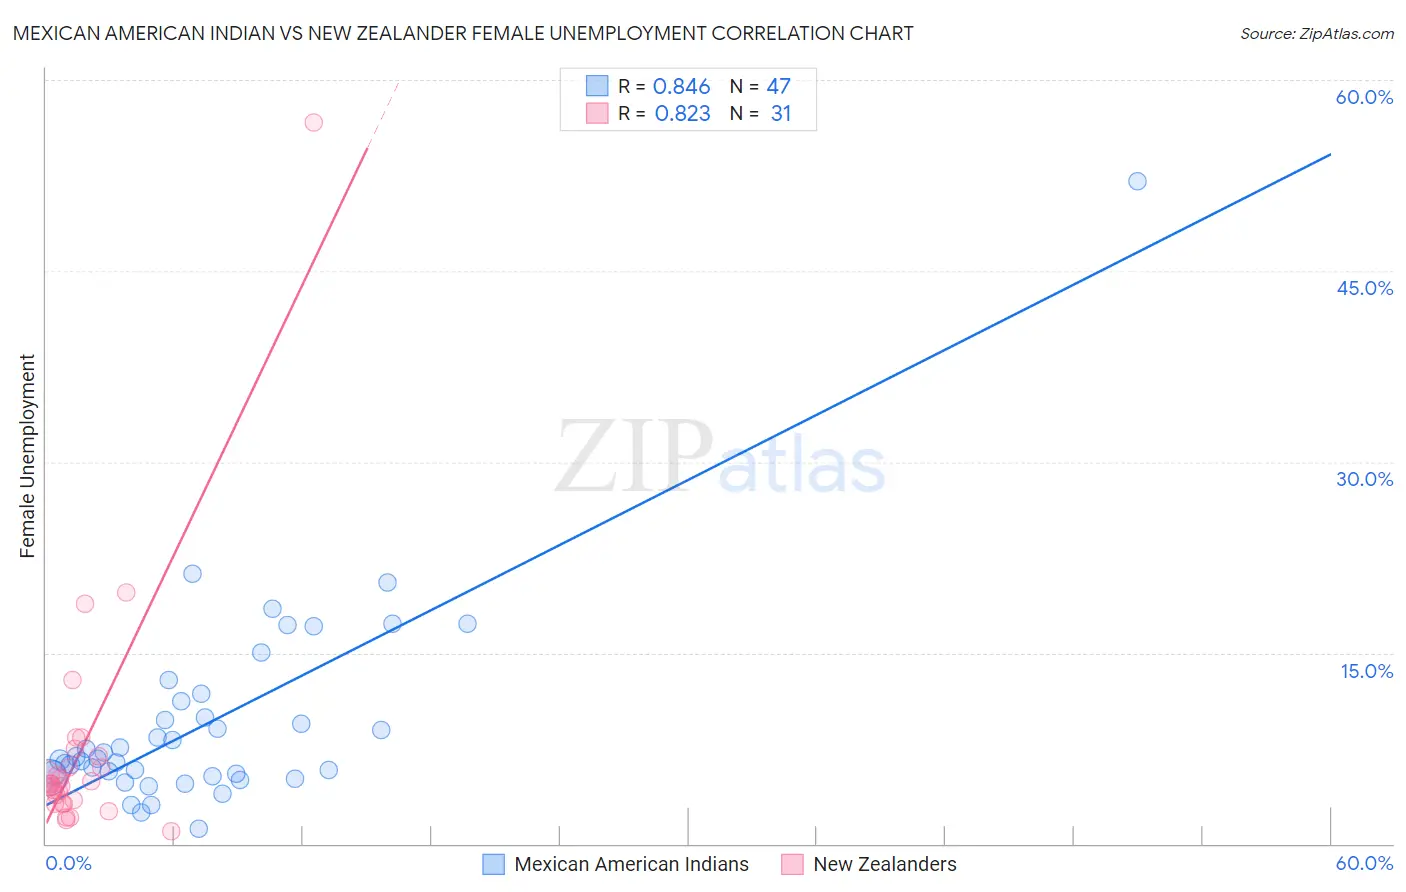
Mexican American Indian vs New Zealander Female Unemployment Correlation Chart
The statistical analysis conducted on geographies consisting of 316,627,877 people shows a very strong positive correlation between the proportion of Mexican American Indians and unemploymnet rate among females in the United States with a correlation coefficient (R) of 0.846 and weighted average of 6.0%. Similarly, the statistical analysis conducted on geographies consisting of 106,766,859 people shows a very strong positive correlation between the proportion of New Zealanders and unemploymnet rate among females in the United States with a correlation coefficient (R) of 0.823 and weighted average of 5.0%, a difference of 21.0%.
Female Unemployment Correlation Summary
| Measurement | Mexican American Indian | New Zealander |
| Minimum | 1.2% | 1.0% |
| Maximum | 52.0% | 56.7% |
| Range | 50.8% | 55.7% |
| Mean | 9.5% | 7.4% |
| Median | 6.7% | 4.7% |
| Interquartile 25% (IQ1) | 5.3% | 3.2% |
| Interquartile 75% (IQ3) | 11.2% | 6.9% |
| Interquartile Range (IQR) | 5.9% | 3.7% |
| Standard Deviation (Sample) | 8.0% | 10.1% |
| Standard Deviation (Population) | 8.0% | 9.9% |
Similar Demographics by Female Unemployment
Demographics Similar to Mexican American Indians by Female Unemployment
In terms of female unemployment, the demographic groups most similar to Mexican American Indians are Guatemalan (6.0%, a difference of 0.040%), Armenian (6.0%, a difference of 0.060%), Immigrants from Ghana (6.0%, a difference of 0.17%), Yaqui (6.0%, a difference of 0.17%), and Colville (6.0%, a difference of 0.31%).
| Demographics | Rating | Rank | Female Unemployment |
| Ghanaians | 0.0 /100 | #273 | Tragic 5.9% |
| Africans | 0.0 /100 | #274 | Tragic 5.9% |
| Senegalese | 0.0 /100 | #275 | Tragic 6.0% |
| Bahamians | 0.0 /100 | #276 | Tragic 6.0% |
| Immigrants | Ghana | 0.0 /100 | #277 | Tragic 6.0% |
| Yaqui | 0.0 /100 | #278 | Tragic 6.0% |
| Armenians | 0.0 /100 | #279 | Tragic 6.0% |
| Mexican American Indians | 0.0 /100 | #280 | Tragic 6.0% |
| Guatemalans | 0.0 /100 | #281 | Tragic 6.0% |
| Colville | 0.0 /100 | #282 | Tragic 6.0% |
| Salvadorans | 0.0 /100 | #283 | Tragic 6.0% |
| Immigrants | Senegal | 0.0 /100 | #284 | Tragic 6.1% |
| Immigrants | Cabo Verde | 0.0 /100 | #285 | Tragic 6.1% |
| Chippewa | 0.0 /100 | #286 | Tragic 6.1% |
| Immigrants | Guatemala | 0.0 /100 | #287 | Tragic 6.1% |
Demographics Similar to New Zealanders by Female Unemployment
In terms of female unemployment, the demographic groups most similar to New Zealanders are Filipino (5.0%, a difference of 0.020%), Immigrants from Australia (5.0%, a difference of 0.070%), Immigrants from Serbia (5.0%, a difference of 0.090%), Turkish (5.0%, a difference of 0.12%), and Canadian (5.0%, a difference of 0.13%).
| Demographics | Rating | Rank | Female Unemployment |
| Russians | 98.0 /100 | #73 | Exceptional 5.0% |
| Immigrants | Bolivia | 98.0 /100 | #74 | Exceptional 5.0% |
| Immigrants | Singapore | 98.0 /100 | #75 | Exceptional 5.0% |
| Immigrants | Venezuela | 97.9 /100 | #76 | Exceptional 5.0% |
| Mongolians | 97.8 /100 | #77 | Exceptional 5.0% |
| Immigrants | Netherlands | 97.8 /100 | #78 | Exceptional 5.0% |
| Turks | 97.6 /100 | #79 | Exceptional 5.0% |
| New Zealanders | 97.4 /100 | #80 | Exceptional 5.0% |
| Filipinos | 97.3 /100 | #81 | Exceptional 5.0% |
| Immigrants | Australia | 97.3 /100 | #82 | Exceptional 5.0% |
| Immigrants | Serbia | 97.2 /100 | #83 | Exceptional 5.0% |
| Canadians | 97.2 /100 | #84 | Exceptional 5.0% |
| Ukrainians | 97.1 /100 | #85 | Exceptional 5.0% |
| Bolivians | 97.1 /100 | #86 | Exceptional 5.0% |
| Venezuelans | 96.9 /100 | #87 | Exceptional 5.0% |