Immigrants from Turkey vs New Zealander Female Unemployment
COMPARE
Immigrants from Turkey
New Zealander
Female Unemployment
Female Unemployment Comparison
Immigrants from Turkey
New Zealanders
5.1%
FEMALE UNEMPLOYMENT
91.0/ 100
METRIC RATING
114th/ 347
METRIC RANK
5.0%
FEMALE UNEMPLOYMENT
97.4/ 100
METRIC RATING
80th/ 347
METRIC RANK
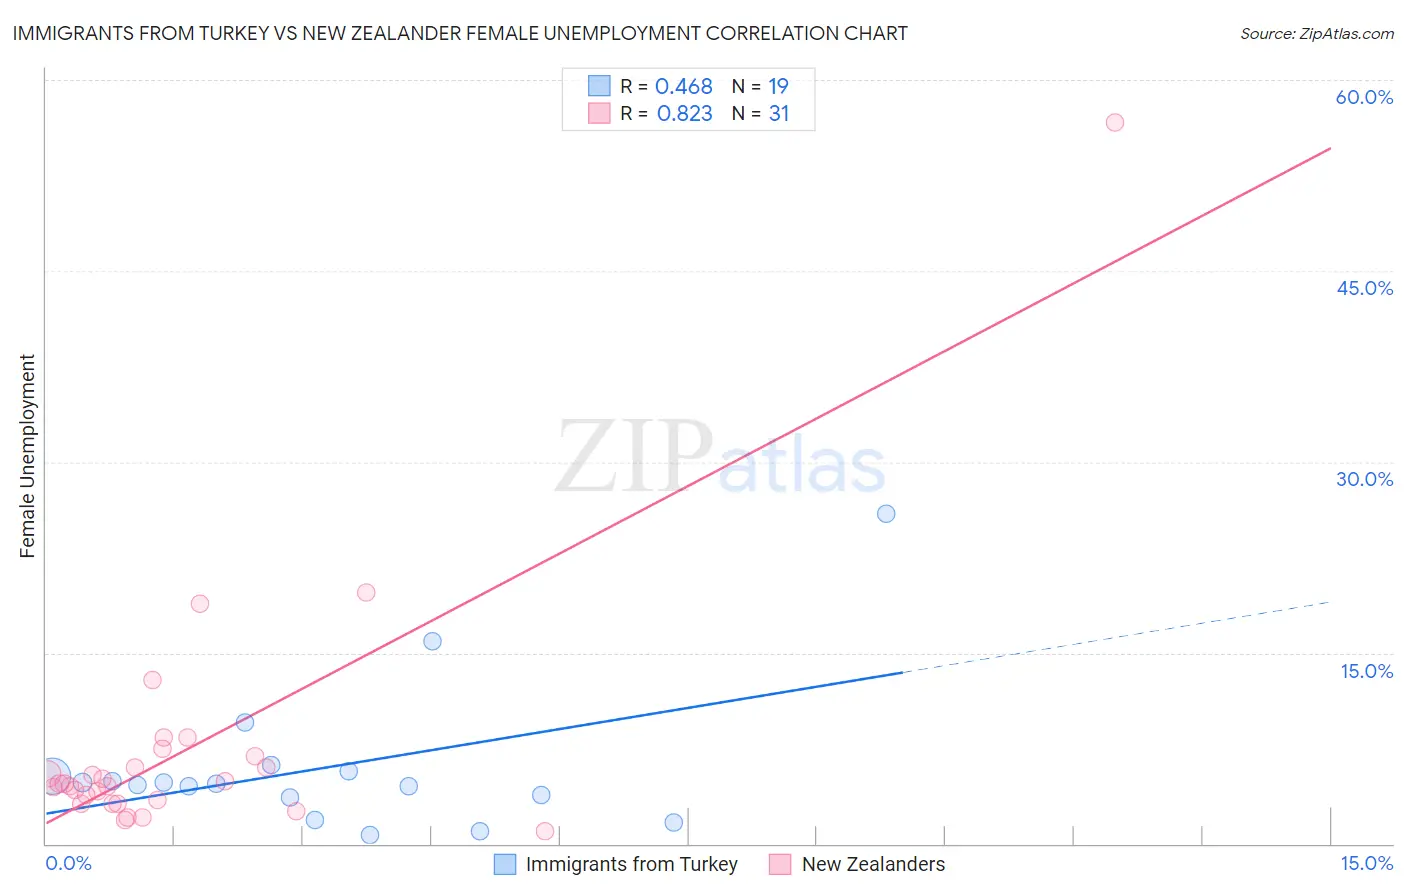
Immigrants from Turkey vs New Zealander Female Unemployment Correlation Chart
The statistical analysis conducted on geographies consisting of 222,692,484 people shows a moderate positive correlation between the proportion of Immigrants from Turkey and unemploymnet rate among females in the United States with a correlation coefficient (R) of 0.468 and weighted average of 5.1%. Similarly, the statistical analysis conducted on geographies consisting of 106,766,859 people shows a very strong positive correlation between the proportion of New Zealanders and unemploymnet rate among females in the United States with a correlation coefficient (R) of 0.823 and weighted average of 5.0%, a difference of 2.1%.
Female Unemployment Correlation Summary
| Measurement | Immigrants from Turkey | New Zealander |
| Minimum | 0.70% | 1.0% |
| Maximum | 25.9% | 56.7% |
| Range | 25.2% | 55.7% |
| Mean | 6.0% | 7.4% |
| Median | 4.8% | 4.7% |
| Interquartile 25% (IQ1) | 3.6% | 3.2% |
| Interquartile 75% (IQ3) | 5.7% | 6.9% |
| Interquartile Range (IQR) | 2.1% | 3.7% |
| Standard Deviation (Sample) | 5.9% | 10.1% |
| Standard Deviation (Population) | 5.7% | 9.9% |
Similar Demographics by Female Unemployment
Demographics Similar to Immigrants from Turkey by Female Unemployment
In terms of female unemployment, the demographic groups most similar to Immigrants from Turkey are Lebanese (5.1%, a difference of 0.020%), Immigrants from Saudi Arabia (5.1%, a difference of 0.040%), American (5.1%, a difference of 0.10%), Jordanian (5.1%, a difference of 0.14%), and Immigrants from Croatia (5.1%, a difference of 0.20%).
| Demographics | Rating | Rank | Female Unemployment |
| Immigrants | Switzerland | 93.1 /100 | #107 | Exceptional 5.1% |
| Puget Sound Salish | 93.0 /100 | #108 | Exceptional 5.1% |
| Immigrants | Eastern Africa | 92.8 /100 | #109 | Exceptional 5.1% |
| Macedonians | 92.4 /100 | #110 | Exceptional 5.1% |
| Immigrants | Burma/Myanmar | 92.3 /100 | #111 | Exceptional 5.1% |
| Estonians | 92.1 /100 | #112 | Exceptional 5.1% |
| Immigrants | Saudi Arabia | 91.2 /100 | #113 | Exceptional 5.1% |
| Immigrants | Turkey | 91.0 /100 | #114 | Exceptional 5.1% |
| Lebanese | 91.0 /100 | #115 | Exceptional 5.1% |
| Americans | 90.5 /100 | #116 | Exceptional 5.1% |
| Jordanians | 90.3 /100 | #117 | Exceptional 5.1% |
| Immigrants | Croatia | 89.9 /100 | #118 | Excellent 5.1% |
| Immigrants | North Macedonia | 88.3 /100 | #119 | Excellent 5.1% |
| Immigrants | Romania | 88.1 /100 | #120 | Excellent 5.1% |
| Immigrants | Western Europe | 88.1 /100 | #121 | Excellent 5.1% |
Demographics Similar to New Zealanders by Female Unemployment
In terms of female unemployment, the demographic groups most similar to New Zealanders are Filipino (5.0%, a difference of 0.020%), Immigrants from Australia (5.0%, a difference of 0.070%), Immigrants from Serbia (5.0%, a difference of 0.090%), Turkish (5.0%, a difference of 0.12%), and Canadian (5.0%, a difference of 0.13%).
| Demographics | Rating | Rank | Female Unemployment |
| Russians | 98.0 /100 | #73 | Exceptional 5.0% |
| Immigrants | Bolivia | 98.0 /100 | #74 | Exceptional 5.0% |
| Immigrants | Singapore | 98.0 /100 | #75 | Exceptional 5.0% |
| Immigrants | Venezuela | 97.9 /100 | #76 | Exceptional 5.0% |
| Mongolians | 97.8 /100 | #77 | Exceptional 5.0% |
| Immigrants | Netherlands | 97.8 /100 | #78 | Exceptional 5.0% |
| Turks | 97.6 /100 | #79 | Exceptional 5.0% |
| New Zealanders | 97.4 /100 | #80 | Exceptional 5.0% |
| Filipinos | 97.3 /100 | #81 | Exceptional 5.0% |
| Immigrants | Australia | 97.3 /100 | #82 | Exceptional 5.0% |
| Immigrants | Serbia | 97.2 /100 | #83 | Exceptional 5.0% |
| Canadians | 97.2 /100 | #84 | Exceptional 5.0% |
| Ukrainians | 97.1 /100 | #85 | Exceptional 5.0% |
| Bolivians | 97.1 /100 | #86 | Exceptional 5.0% |
| Venezuelans | 96.9 /100 | #87 | Exceptional 5.0% |