Immigrants from Cambodia vs Korean Unemployment
COMPARE
Immigrants from Cambodia
Korean
Unemployment
Unemployment Comparison
Immigrants from Cambodia
Koreans
5.5%
UNEMPLOYMENT
3.3/ 100
METRIC RATING
236th/ 347
METRIC RANK
5.3%
UNEMPLOYMENT
27.4/ 100
METRIC RATING
200th/ 347
METRIC RANK
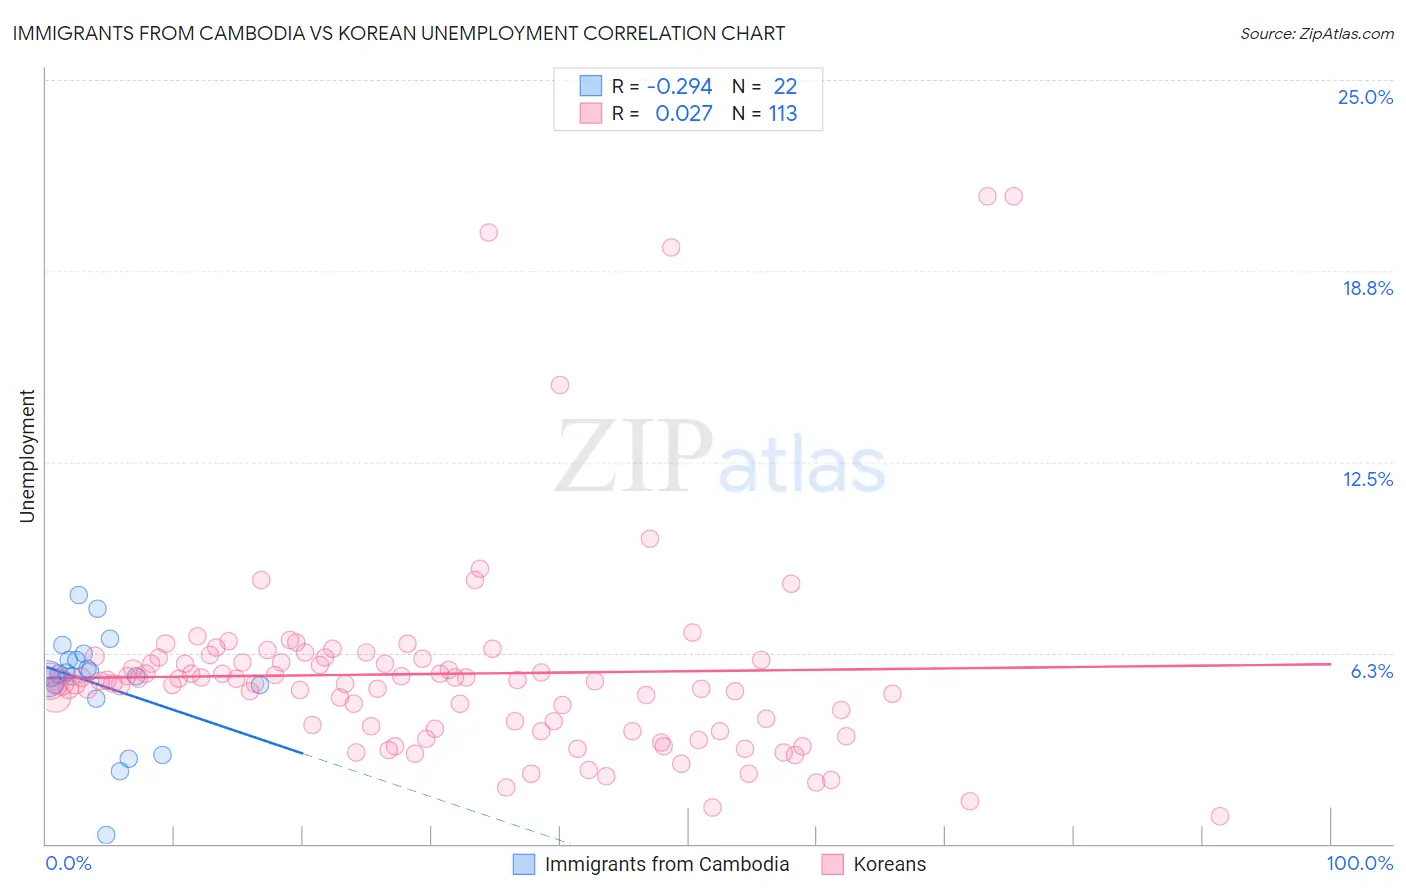
Immigrants from Cambodia vs Korean Unemployment Correlation Chart
The statistical analysis conducted on geographies consisting of 205,100,731 people shows a weak negative correlation between the proportion of Immigrants from Cambodia and unemployment in the United States with a correlation coefficient (R) of -0.294 and weighted average of 5.5%. Similarly, the statistical analysis conducted on geographies consisting of 509,828,935 people shows no correlation between the proportion of Koreans and unemployment in the United States with a correlation coefficient (R) of 0.027 and weighted average of 5.3%, a difference of 3.6%.
Unemployment Correlation Summary
| Measurement | Immigrants from Cambodia | Korean |
| Minimum | 0.30% | 0.90% |
| Maximum | 8.1% | 21.2% |
| Range | 7.8% | 20.3% |
| Mean | 5.2% | 5.6% |
| Median | 5.5% | 5.3% |
| Interquartile 25% (IQ1) | 5.2% | 3.7% |
| Interquartile 75% (IQ3) | 6.0% | 6.0% |
| Interquartile Range (IQR) | 0.83% | 2.3% |
| Standard Deviation (Sample) | 1.8% | 3.4% |
| Standard Deviation (Population) | 1.7% | 3.4% |
Similar Demographics by Unemployment
Demographics Similar to Immigrants from Cambodia by Unemployment
In terms of unemployment, the demographic groups most similar to Immigrants from Cambodia are Immigrants from Panama (5.5%, a difference of 0.030%), Moroccan (5.5%, a difference of 0.060%), Immigrants from Western Asia (5.5%, a difference of 0.27%), Immigrants (5.5%, a difference of 0.36%), and Cree (5.6%, a difference of 0.37%).
| Demographics | Rating | Rank | Unemployment |
| Hawaiians | 5.4 /100 | #229 | Tragic 5.5% |
| Ottawa | 5.4 /100 | #230 | Tragic 5.5% |
| Immigrants | Africa | 4.9 /100 | #231 | Tragic 5.5% |
| Comanche | 4.9 /100 | #232 | Tragic 5.5% |
| Immigrants | Syria | 4.8 /100 | #233 | Tragic 5.5% |
| Panamanians | 4.7 /100 | #234 | Tragic 5.5% |
| Immigrants | Panama | 3.4 /100 | #235 | Tragic 5.5% |
| Immigrants | Cambodia | 3.3 /100 | #236 | Tragic 5.5% |
| Moroccans | 3.2 /100 | #237 | Tragic 5.5% |
| Immigrants | Western Asia | 2.8 /100 | #238 | Tragic 5.5% |
| Immigrants | Immigrants | 2.6 /100 | #239 | Tragic 5.5% |
| Cree | 2.6 /100 | #240 | Tragic 5.6% |
| Tlingit-Haida | 2.0 /100 | #241 | Tragic 5.6% |
| Spanish Americans | 2.0 /100 | #242 | Tragic 5.6% |
| Marshallese | 1.3 /100 | #243 | Tragic 5.6% |
Demographics Similar to Koreans by Unemployment
In terms of unemployment, the demographic groups most similar to Koreans are Immigrants from South Eastern Asia (5.3%, a difference of 0.030%), Immigrants from Israel (5.3%, a difference of 0.090%), Immigrants from Afghanistan (5.3%, a difference of 0.090%), Cherokee (5.3%, a difference of 0.14%), and Immigrants from Micronesia (5.3%, a difference of 0.17%).
| Demographics | Rating | Rank | Unemployment |
| Immigrants | Somalia | 33.8 /100 | #193 | Fair 5.3% |
| Immigrants | Laos | 30.9 /100 | #194 | Fair 5.3% |
| Immigrants | Southern Europe | 30.9 /100 | #195 | Fair 5.3% |
| Peruvians | 29.9 /100 | #196 | Fair 5.3% |
| Immigrants | Uruguay | 29.8 /100 | #197 | Fair 5.3% |
| Immigrants | Israel | 28.6 /100 | #198 | Fair 5.3% |
| Immigrants | Afghanistan | 28.6 /100 | #199 | Fair 5.3% |
| Koreans | 27.4 /100 | #200 | Fair 5.3% |
| Immigrants | South Eastern Asia | 27.0 /100 | #201 | Fair 5.3% |
| Cherokee | 25.5 /100 | #202 | Fair 5.3% |
| Immigrants | Micronesia | 25.2 /100 | #203 | Fair 5.3% |
| Immigrants | Ukraine | 24.9 /100 | #204 | Fair 5.3% |
| Native Hawaiians | 24.1 /100 | #205 | Fair 5.3% |
| Immigrants | Peru | 22.7 /100 | #206 | Fair 5.4% |
| Creek | 19.4 /100 | #207 | Poor 5.4% |