Immigrants from Cambodia vs Immigrants from Vietnam Unemployment
COMPARE
Immigrants from Cambodia
Immigrants from Vietnam
Unemployment
Unemployment Comparison
Immigrants from Cambodia
Immigrants from Vietnam
5.5%
UNEMPLOYMENT
3.3/ 100
METRIC RATING
236th/ 347
METRIC RANK
5.2%
UNEMPLOYMENT
52.5/ 100
METRIC RATING
172nd/ 347
METRIC RANK
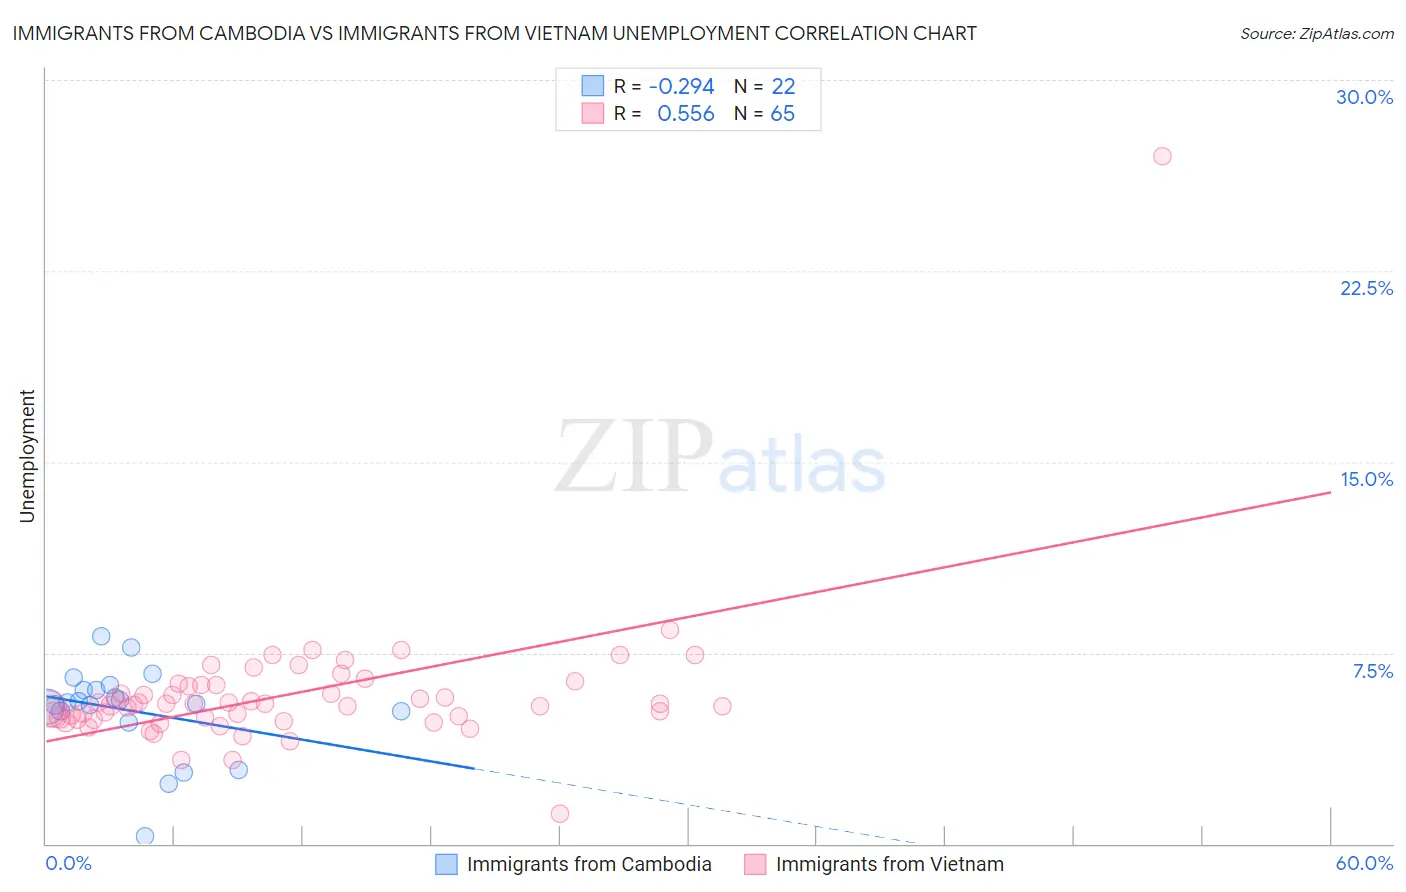
Immigrants from Cambodia vs Immigrants from Vietnam Unemployment Correlation Chart
The statistical analysis conducted on geographies consisting of 205,100,731 people shows a weak negative correlation between the proportion of Immigrants from Cambodia and unemployment in the United States with a correlation coefficient (R) of -0.294 and weighted average of 5.5%. Similarly, the statistical analysis conducted on geographies consisting of 404,504,928 people shows a substantial positive correlation between the proportion of Immigrants from Vietnam and unemployment in the United States with a correlation coefficient (R) of 0.556 and weighted average of 5.2%, a difference of 5.3%.
Unemployment Correlation Summary
| Measurement | Immigrants from Cambodia | Immigrants from Vietnam |
| Minimum | 0.30% | 1.2% |
| Maximum | 8.1% | 27.0% |
| Range | 7.8% | 25.8% |
| Mean | 5.2% | 5.9% |
| Median | 5.5% | 5.5% |
| Interquartile 25% (IQ1) | 5.2% | 4.9% |
| Interquartile 75% (IQ3) | 6.0% | 6.2% |
| Interquartile Range (IQR) | 0.83% | 1.3% |
| Standard Deviation (Sample) | 1.8% | 2.9% |
| Standard Deviation (Population) | 1.7% | 2.9% |
Similar Demographics by Unemployment
Demographics Similar to Immigrants from Cambodia by Unemployment
In terms of unemployment, the demographic groups most similar to Immigrants from Cambodia are Immigrants from Panama (5.5%, a difference of 0.030%), Moroccan (5.5%, a difference of 0.060%), Immigrants from Western Asia (5.5%, a difference of 0.27%), Immigrants (5.5%, a difference of 0.36%), and Cree (5.6%, a difference of 0.37%).
| Demographics | Rating | Rank | Unemployment |
| Hawaiians | 5.4 /100 | #229 | Tragic 5.5% |
| Ottawa | 5.4 /100 | #230 | Tragic 5.5% |
| Immigrants | Africa | 4.9 /100 | #231 | Tragic 5.5% |
| Comanche | 4.9 /100 | #232 | Tragic 5.5% |
| Immigrants | Syria | 4.8 /100 | #233 | Tragic 5.5% |
| Panamanians | 4.7 /100 | #234 | Tragic 5.5% |
| Immigrants | Panama | 3.4 /100 | #235 | Tragic 5.5% |
| Immigrants | Cambodia | 3.3 /100 | #236 | Tragic 5.5% |
| Moroccans | 3.2 /100 | #237 | Tragic 5.5% |
| Immigrants | Western Asia | 2.8 /100 | #238 | Tragic 5.5% |
| Immigrants | Immigrants | 2.6 /100 | #239 | Tragic 5.5% |
| Cree | 2.6 /100 | #240 | Tragic 5.6% |
| Tlingit-Haida | 2.0 /100 | #241 | Tragic 5.6% |
| Spanish Americans | 2.0 /100 | #242 | Tragic 5.6% |
| Marshallese | 1.3 /100 | #243 | Tragic 5.6% |
Demographics Similar to Immigrants from Vietnam by Unemployment
In terms of unemployment, the demographic groups most similar to Immigrants from Vietnam are Immigrants from Poland (5.3%, a difference of 0.040%), Immigrants from Congo (5.3%, a difference of 0.15%), Taiwanese (5.3%, a difference of 0.18%), Nicaraguan (5.3%, a difference of 0.24%), and Puget Sound Salish (5.2%, a difference of 0.25%).
| Demographics | Rating | Rank | Unemployment |
| Immigrants | Brazil | 63.1 /100 | #165 | Good 5.2% |
| Immigrants | Indonesia | 61.2 /100 | #166 | Good 5.2% |
| Colombians | 61.1 /100 | #167 | Good 5.2% |
| Uruguayans | 60.2 /100 | #168 | Good 5.2% |
| Immigrants | Morocco | 59.1 /100 | #169 | Average 5.2% |
| Immigrants | Nicaragua | 57.1 /100 | #170 | Average 5.2% |
| Puget Sound Salish | 56.6 /100 | #171 | Average 5.2% |
| Immigrants | Vietnam | 52.5 /100 | #172 | Average 5.2% |
| Immigrants | Poland | 51.8 /100 | #173 | Average 5.3% |
| Immigrants | Congo | 50.0 /100 | #174 | Average 5.3% |
| Taiwanese | 49.6 /100 | #175 | Average 5.3% |
| Nicaraguans | 48.7 /100 | #176 | Average 5.3% |
| Immigrants | Nonimmigrants | 47.9 /100 | #177 | Average 5.3% |
| Afghans | 47.4 /100 | #178 | Average 5.3% |
| Malaysians | 46.8 /100 | #179 | Average 5.3% |