Immigrants from Burma/Myanmar vs Immigrants from Bosnia and Herzegovina Unemployment Among Ages 25 to 29 years
COMPARE
Immigrants from Burma/Myanmar
Immigrants from Bosnia and Herzegovina
Unemployment Among Ages 25 to 29 years
Unemployment Among Ages 25 to 29 years Comparison
Immigrants from Burma/Myanmar
Immigrants from Bosnia and Herzegovina
6.2%
UNEMPLOYMENT AMONG AGES 25 TO 29 YEARS
98.7/ 100
METRIC RATING
56th/ 347
METRIC RANK
5.7%
UNEMPLOYMENT AMONG AGES 25 TO 29 YEARS
100.0/ 100
METRIC RATING
8th/ 347
METRIC RANK
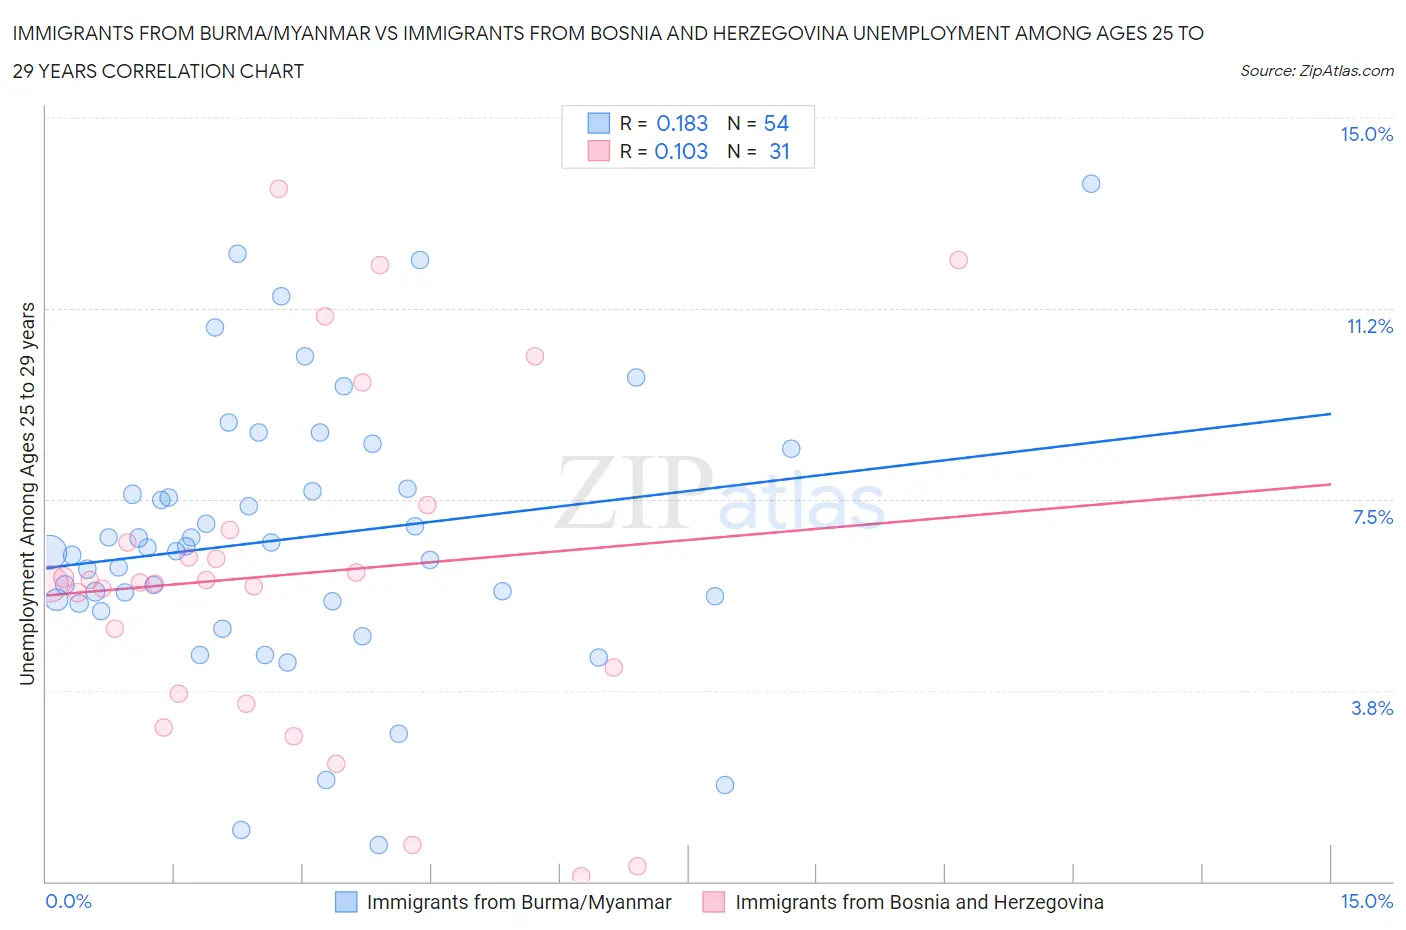
Immigrants from Burma/Myanmar vs Immigrants from Bosnia and Herzegovina Unemployment Among Ages 25 to 29 years Correlation Chart
The statistical analysis conducted on geographies consisting of 169,671,818 people shows a poor positive correlation between the proportion of Immigrants from Burma/Myanmar and unemployment rate among population between the ages 25 and 29 in the United States with a correlation coefficient (R) of 0.183 and weighted average of 6.2%. Similarly, the statistical analysis conducted on geographies consisting of 153,450,530 people shows a poor positive correlation between the proportion of Immigrants from Bosnia and Herzegovina and unemployment rate among population between the ages 25 and 29 in the United States with a correlation coefficient (R) of 0.103 and weighted average of 5.7%, a difference of 9.5%.
Unemployment Among Ages 25 to 29 years Correlation Summary
| Measurement | Immigrants from Burma/Myanmar | Immigrants from Bosnia and Herzegovina |
| Minimum | 0.70% | 0.10% |
| Maximum | 13.7% | 13.6% |
| Range | 13.0% | 13.5% |
| Mean | 6.7% | 6.0% |
| Median | 6.5% | 5.9% |
| Interquartile 25% (IQ1) | 5.5% | 3.7% |
| Interquartile 75% (IQ3) | 7.7% | 6.9% |
| Interquartile Range (IQR) | 2.2% | 3.2% |
| Standard Deviation (Sample) | 2.7% | 3.4% |
| Standard Deviation (Population) | 2.6% | 3.3% |
Similar Demographics by Unemployment Among Ages 25 to 29 years
Demographics Similar to Immigrants from Burma/Myanmar by Unemployment Among Ages 25 to 29 years
In terms of unemployment among ages 25 to 29 years, the demographic groups most similar to Immigrants from Burma/Myanmar are Immigrants from Netherlands (6.2%, a difference of 0.020%), Immigrants from Saudi Arabia (6.2%, a difference of 0.090%), Swedish (6.2%, a difference of 0.20%), Turkish (6.2%, a difference of 0.22%), and Immigrants from Eastern Asia (6.2%, a difference of 0.25%).
| Demographics | Rating | Rank | Unemployment Among Ages 25 to 29 years |
| German Russians | 99.0 /100 | #49 | Exceptional 6.2% |
| Soviet Union | 98.9 /100 | #50 | Exceptional 6.2% |
| Burmese | 98.9 /100 | #51 | Exceptional 6.2% |
| Immigrants | Turkey | 98.9 /100 | #52 | Exceptional 6.2% |
| Turks | 98.8 /100 | #53 | Exceptional 6.2% |
| Swedes | 98.8 /100 | #54 | Exceptional 6.2% |
| Immigrants | Netherlands | 98.7 /100 | #55 | Exceptional 6.2% |
| Immigrants | Burma/Myanmar | 98.7 /100 | #56 | Exceptional 6.2% |
| Immigrants | Saudi Arabia | 98.6 /100 | #57 | Exceptional 6.2% |
| Immigrants | Eastern Asia | 98.4 /100 | #58 | Exceptional 6.2% |
| Luxembourgers | 98.3 /100 | #59 | Exceptional 6.2% |
| Immigrants | Taiwan | 98.3 /100 | #60 | Exceptional 6.2% |
| Bhutanese | 98.2 /100 | #61 | Exceptional 6.2% |
| Immigrants | China | 98.1 /100 | #62 | Exceptional 6.2% |
| Kenyans | 98.0 /100 | #63 | Exceptional 6.3% |
Demographics Similar to Immigrants from Bosnia and Herzegovina by Unemployment Among Ages 25 to 29 years
In terms of unemployment among ages 25 to 29 years, the demographic groups most similar to Immigrants from Bosnia and Herzegovina are Immigrants from India (5.7%, a difference of 0.12%), Hmong (5.7%, a difference of 0.20%), Somali (5.6%, a difference of 0.39%), Immigrants from Cuba (5.6%, a difference of 0.45%), and Immigrants from Nepal (5.7%, a difference of 1.3%).
| Demographics | Rating | Rank | Unemployment Among Ages 25 to 29 years |
| Sudanese | 100.0 /100 | #1 | Exceptional 5.4% |
| Tongans | 100.0 /100 | #2 | Exceptional 5.5% |
| Immigrants | Somalia | 100.0 /100 | #3 | Exceptional 5.5% |
| Immigrants | Cuba | 100.0 /100 | #4 | Exceptional 5.6% |
| Somalis | 100.0 /100 | #5 | Exceptional 5.6% |
| Hmong | 100.0 /100 | #6 | Exceptional 5.7% |
| Immigrants | India | 100.0 /100 | #7 | Exceptional 5.7% |
| Immigrants | Bosnia and Herzegovina | 100.0 /100 | #8 | Exceptional 5.7% |
| Immigrants | Nepal | 100.0 /100 | #9 | Exceptional 5.7% |
| Immigrants | Sudan | 100.0 /100 | #10 | Exceptional 5.8% |
| Cambodians | 100.0 /100 | #11 | Exceptional 5.8% |
| Okinawans | 100.0 /100 | #12 | Exceptional 5.9% |
| Immigrants | Bolivia | 100.0 /100 | #13 | Exceptional 5.9% |
| Immigrants | Kuwait | 99.9 /100 | #14 | Exceptional 5.9% |
| Cubans | 99.9 /100 | #15 | Exceptional 5.9% |