Immigrants from Burma/Myanmar vs Immigrants from Belize Unemployment Among Ages 25 to 29 years
COMPARE
Immigrants from Burma/Myanmar
Immigrants from Belize
Unemployment Among Ages 25 to 29 years
Unemployment Among Ages 25 to 29 years Comparison
Immigrants from Burma/Myanmar
Immigrants from Belize
6.2%
UNEMPLOYMENT AMONG AGES 25 TO 29 YEARS
98.7/ 100
METRIC RATING
56th/ 347
METRIC RANK
7.8%
UNEMPLOYMENT AMONG AGES 25 TO 29 YEARS
0.0/ 100
METRIC RATING
293rd/ 347
METRIC RANK
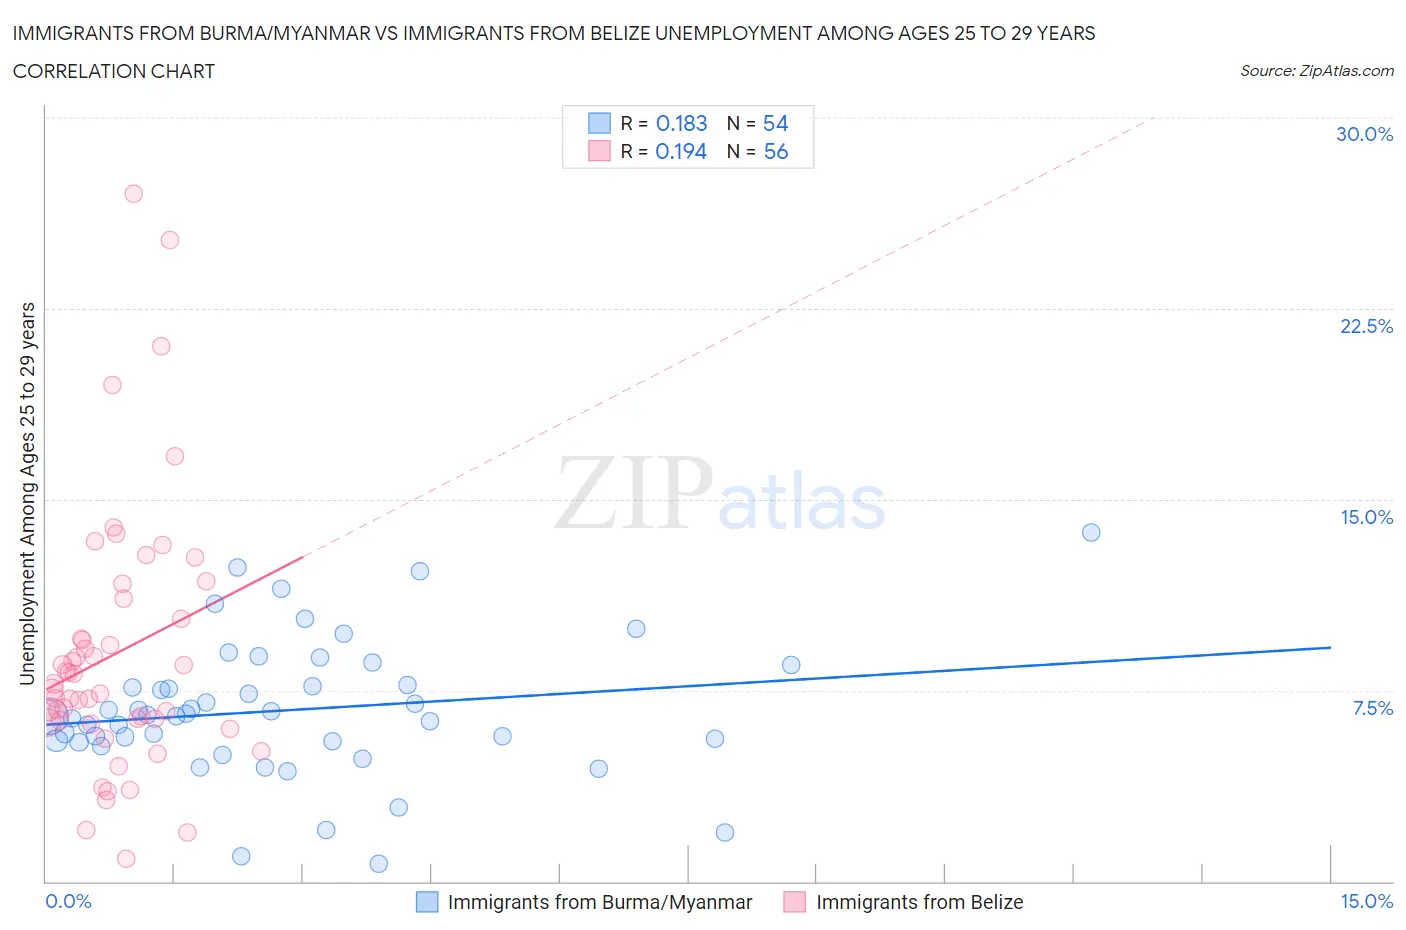
Immigrants from Burma/Myanmar vs Immigrants from Belize Unemployment Among Ages 25 to 29 years Correlation Chart
The statistical analysis conducted on geographies consisting of 169,671,818 people shows a poor positive correlation between the proportion of Immigrants from Burma/Myanmar and unemployment rate among population between the ages 25 and 29 in the United States with a correlation coefficient (R) of 0.183 and weighted average of 6.2%. Similarly, the statistical analysis conducted on geographies consisting of 128,941,417 people shows a poor positive correlation between the proportion of Immigrants from Belize and unemployment rate among population between the ages 25 and 29 in the United States with a correlation coefficient (R) of 0.194 and weighted average of 7.8%, a difference of 25.1%.
Unemployment Among Ages 25 to 29 years Correlation Summary
| Measurement | Immigrants from Burma/Myanmar | Immigrants from Belize |
| Minimum | 0.70% | 0.90% |
| Maximum | 13.7% | 27.0% |
| Range | 13.0% | 26.1% |
| Mean | 6.7% | 8.9% |
| Median | 6.5% | 7.6% |
| Interquartile 25% (IQ1) | 5.5% | 6.3% |
| Interquartile 75% (IQ3) | 7.7% | 10.7% |
| Interquartile Range (IQR) | 2.2% | 4.4% |
| Standard Deviation (Sample) | 2.7% | 5.2% |
| Standard Deviation (Population) | 2.6% | 5.1% |
Similar Demographics by Unemployment Among Ages 25 to 29 years
Demographics Similar to Immigrants from Burma/Myanmar by Unemployment Among Ages 25 to 29 years
In terms of unemployment among ages 25 to 29 years, the demographic groups most similar to Immigrants from Burma/Myanmar are Immigrants from Netherlands (6.2%, a difference of 0.020%), Immigrants from Saudi Arabia (6.2%, a difference of 0.090%), Swedish (6.2%, a difference of 0.20%), Turkish (6.2%, a difference of 0.22%), and Immigrants from Eastern Asia (6.2%, a difference of 0.25%).
| Demographics | Rating | Rank | Unemployment Among Ages 25 to 29 years |
| German Russians | 99.0 /100 | #49 | Exceptional 6.2% |
| Soviet Union | 98.9 /100 | #50 | Exceptional 6.2% |
| Burmese | 98.9 /100 | #51 | Exceptional 6.2% |
| Immigrants | Turkey | 98.9 /100 | #52 | Exceptional 6.2% |
| Turks | 98.8 /100 | #53 | Exceptional 6.2% |
| Swedes | 98.8 /100 | #54 | Exceptional 6.2% |
| Immigrants | Netherlands | 98.7 /100 | #55 | Exceptional 6.2% |
| Immigrants | Burma/Myanmar | 98.7 /100 | #56 | Exceptional 6.2% |
| Immigrants | Saudi Arabia | 98.6 /100 | #57 | Exceptional 6.2% |
| Immigrants | Eastern Asia | 98.4 /100 | #58 | Exceptional 6.2% |
| Luxembourgers | 98.3 /100 | #59 | Exceptional 6.2% |
| Immigrants | Taiwan | 98.3 /100 | #60 | Exceptional 6.2% |
| Bhutanese | 98.2 /100 | #61 | Exceptional 6.2% |
| Immigrants | China | 98.1 /100 | #62 | Exceptional 6.2% |
| Kenyans | 98.0 /100 | #63 | Exceptional 6.3% |
Demographics Similar to Immigrants from Belize by Unemployment Among Ages 25 to 29 years
In terms of unemployment among ages 25 to 29 years, the demographic groups most similar to Immigrants from Belize are Chippewa (7.8%, a difference of 0.050%), Trinidadian and Tobagonian (7.8%, a difference of 0.28%), Hispanic or Latino (7.7%, a difference of 0.46%), Comanche (7.8%, a difference of 0.74%), and Armenian (7.7%, a difference of 0.85%).
| Demographics | Rating | Rank | Unemployment Among Ages 25 to 29 years |
| Vietnamese | 0.0 /100 | #286 | Tragic 7.6% |
| Immigrants | Mexico | 0.0 /100 | #287 | Tragic 7.6% |
| Africans | 0.0 /100 | #288 | Tragic 7.6% |
| Belizeans | 0.0 /100 | #289 | Tragic 7.7% |
| Armenians | 0.0 /100 | #290 | Tragic 7.7% |
| Hispanics or Latinos | 0.0 /100 | #291 | Tragic 7.7% |
| Chippewa | 0.0 /100 | #292 | Tragic 7.8% |
| Immigrants | Belize | 0.0 /100 | #293 | Tragic 7.8% |
| Trinidadians and Tobagonians | 0.0 /100 | #294 | Tragic 7.8% |
| Comanche | 0.0 /100 | #295 | Tragic 7.8% |
| Immigrants | West Indies | 0.0 /100 | #296 | Tragic 7.8% |
| Blackfeet | 0.0 /100 | #297 | Tragic 7.9% |
| Immigrants | Trinidad and Tobago | 0.0 /100 | #298 | Tragic 7.9% |
| Barbadians | 0.0 /100 | #299 | Tragic 7.9% |
| Central American Indians | 0.0 /100 | #300 | Tragic 7.9% |