Inupiat vs Immigrants from Hong Kong Unemployment Among Ages 25 to 29 years
COMPARE
Inupiat
Immigrants from Hong Kong
Unemployment Among Ages 25 to 29 years
Unemployment Among Ages 25 to 29 years Comparison
Inupiat
Immigrants from Hong Kong
13.4%
UNEMPLOYMENT AMONG AGES 25 TO 29 YEARS
0.0/ 100
METRIC RATING
343rd/ 347
METRIC RANK
6.3%
UNEMPLOYMENT AMONG AGES 25 TO 29 YEARS
97.5/ 100
METRIC RATING
69th/ 347
METRIC RANK
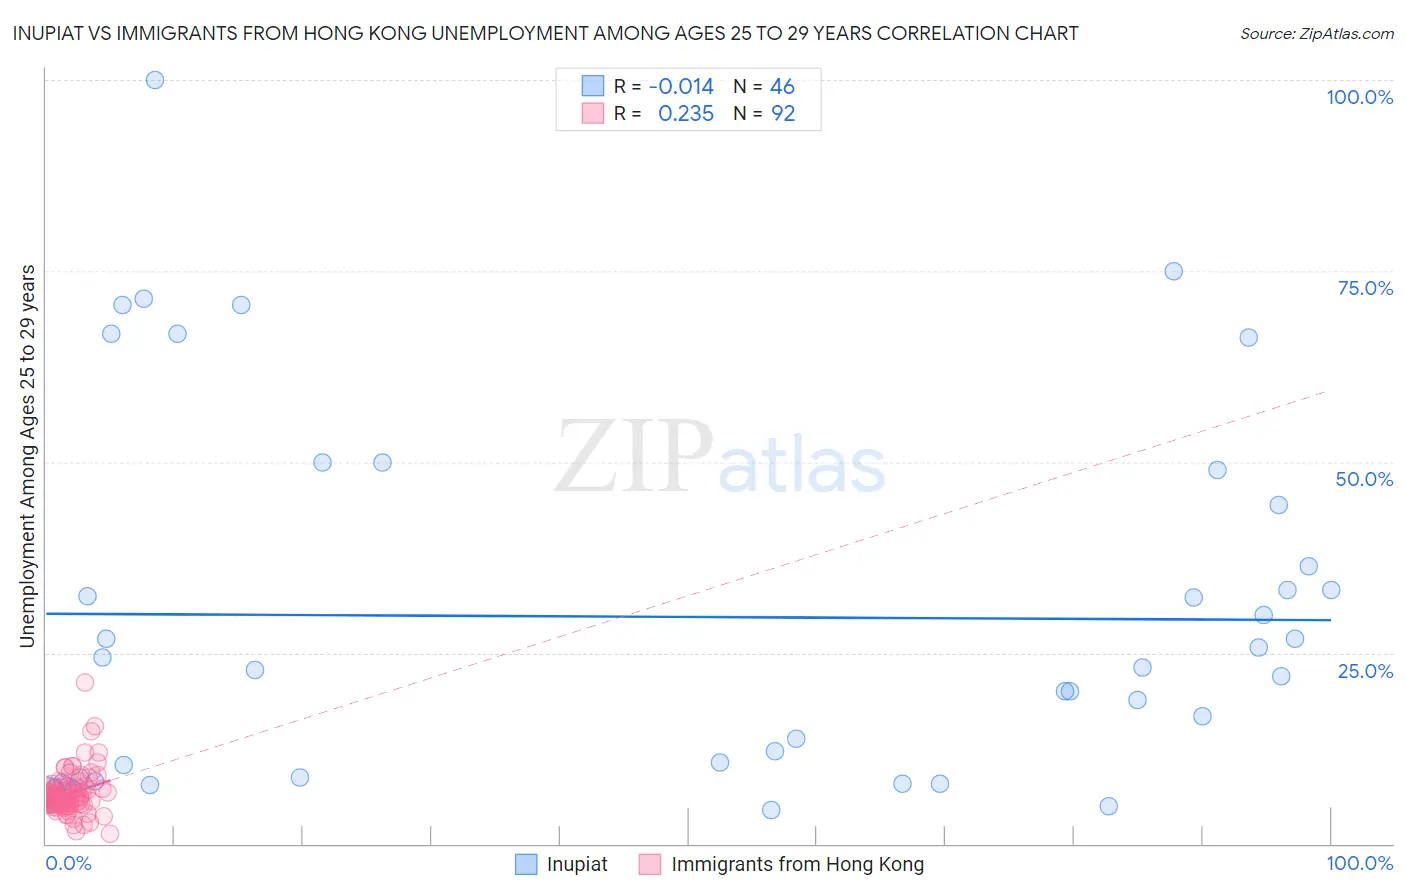
Inupiat vs Immigrants from Hong Kong Unemployment Among Ages 25 to 29 years Correlation Chart
The statistical analysis conducted on geographies consisting of 94,919,463 people shows no correlation between the proportion of Inupiat and unemployment rate among population between the ages 25 and 29 in the United States with a correlation coefficient (R) of -0.014 and weighted average of 13.4%. Similarly, the statistical analysis conducted on geographies consisting of 247,463,754 people shows a weak positive correlation between the proportion of Immigrants from Hong Kong and unemployment rate among population between the ages 25 and 29 in the United States with a correlation coefficient (R) of 0.235 and weighted average of 6.3%, a difference of 114.0%.
Unemployment Among Ages 25 to 29 years Correlation Summary
| Measurement | Inupiat | Immigrants from Hong Kong |
| Minimum | 4.5% | 1.3% |
| Maximum | 100.0% | 21.1% |
| Range | 95.5% | 19.8% |
| Mean | 29.7% | 6.6% |
| Median | 22.9% | 6.1% |
| Interquartile 25% (IQ1) | 8.6% | 5.3% |
| Interquartile 75% (IQ3) | 44.4% | 7.3% |
| Interquartile Range (IQR) | 35.8% | 2.0% |
| Standard Deviation (Sample) | 24.1% | 2.8% |
| Standard Deviation (Population) | 23.9% | 2.8% |
Similar Demographics by Unemployment Among Ages 25 to 29 years
Demographics Similar to Inupiat by Unemployment Among Ages 25 to 29 years
In terms of unemployment among ages 25 to 29 years, the demographic groups most similar to Inupiat are Hopi (13.5%, a difference of 0.65%), Navajo (12.2%, a difference of 10.3%), Tohono O'odham (12.1%, a difference of 11.2%), Cheyenne (11.8%, a difference of 13.5%), and Pima (11.8%, a difference of 14.0%).
| Demographics | Rating | Rank | Unemployment Among Ages 25 to 29 years |
| Alaskan Athabascans | 0.0 /100 | #333 | Tragic 10.8% |
| Yuman | 0.0 /100 | #334 | Tragic 11.0% |
| Puerto Ricans | 0.0 /100 | #335 | Tragic 11.1% |
| Lumbee | 0.0 /100 | #336 | Tragic 11.2% |
| Menominee | 0.0 /100 | #337 | Tragic 11.3% |
| Sioux | 0.0 /100 | #338 | Tragic 11.7% |
| Pima | 0.0 /100 | #339 | Tragic 11.8% |
| Cheyenne | 0.0 /100 | #340 | Tragic 11.8% |
| Tohono O'odham | 0.0 /100 | #341 | Tragic 12.1% |
| Navajo | 0.0 /100 | #342 | Tragic 12.2% |
| Inupiat | 0.0 /100 | #343 | Tragic 13.4% |
| Hopi | 0.0 /100 | #344 | Tragic 13.5% |
| Arapaho | 0.0 /100 | #345 | Tragic 15.4% |
| Crow | 0.0 /100 | #346 | Tragic 15.4% |
| Yup'ik | 0.0 /100 | #347 | Tragic 17.9% |
Demographics Similar to Immigrants from Hong Kong by Unemployment Among Ages 25 to 29 years
In terms of unemployment among ages 25 to 29 years, the demographic groups most similar to Immigrants from Hong Kong are Immigrants from Malaysia (6.3%, a difference of 0.020%), Immigrants from France (6.3%, a difference of 0.060%), Scandinavian (6.3%, a difference of 0.080%), Palestinian (6.3%, a difference of 0.18%), and Indian (Asian) (6.3%, a difference of 0.23%).
| Demographics | Rating | Rank | Unemployment Among Ages 25 to 29 years |
| Immigrants | China | 98.1 /100 | #62 | Exceptional 6.2% |
| Kenyans | 98.0 /100 | #63 | Exceptional 6.3% |
| Immigrants | Sri Lanka | 97.9 /100 | #64 | Exceptional 6.3% |
| Immigrants | Lebanon | 97.8 /100 | #65 | Exceptional 6.3% |
| Indians (Asian) | 97.8 /100 | #66 | Exceptional 6.3% |
| Immigrants | Northern Africa | 97.8 /100 | #67 | Exceptional 6.3% |
| Palestinians | 97.7 /100 | #68 | Exceptional 6.3% |
| Immigrants | Hong Kong | 97.5 /100 | #69 | Exceptional 6.3% |
| Immigrants | Malaysia | 97.5 /100 | #70 | Exceptional 6.3% |
| Immigrants | France | 97.4 /100 | #71 | Exceptional 6.3% |
| Scandinavians | 97.4 /100 | #72 | Exceptional 6.3% |
| Belgians | 97.0 /100 | #73 | Exceptional 6.3% |
| Carpatho Rusyns | 96.9 /100 | #74 | Exceptional 6.3% |
| Immigrants | Jordan | 96.8 /100 | #75 | Exceptional 6.3% |
| Immigrants | Korea | 96.7 /100 | #76 | Exceptional 6.3% |