Immigrants from Bosnia and Herzegovina vs Venezuelan Unemployment Among Women with Children Ages 6 to 17 years
COMPARE
Immigrants from Bosnia and Herzegovina
Venezuelan
Unemployment Among Women with Children Ages 6 to 17 years
Unemployment Among Women with Children Ages 6 to 17 years Comparison
Immigrants from Bosnia and Herzegovina
Venezuelans
8.2%
UNEMPLOYMENT AMONG WOMEN WITH CHILDREN AGES 6 TO 17 YEARS
100.0/ 100
METRIC RATING
56th/ 347
METRIC RANK
10.2%
UNEMPLOYMENT AMONG WOMEN WITH CHILDREN AGES 6 TO 17 YEARS
0.0/ 100
METRIC RATING
302nd/ 347
METRIC RANK
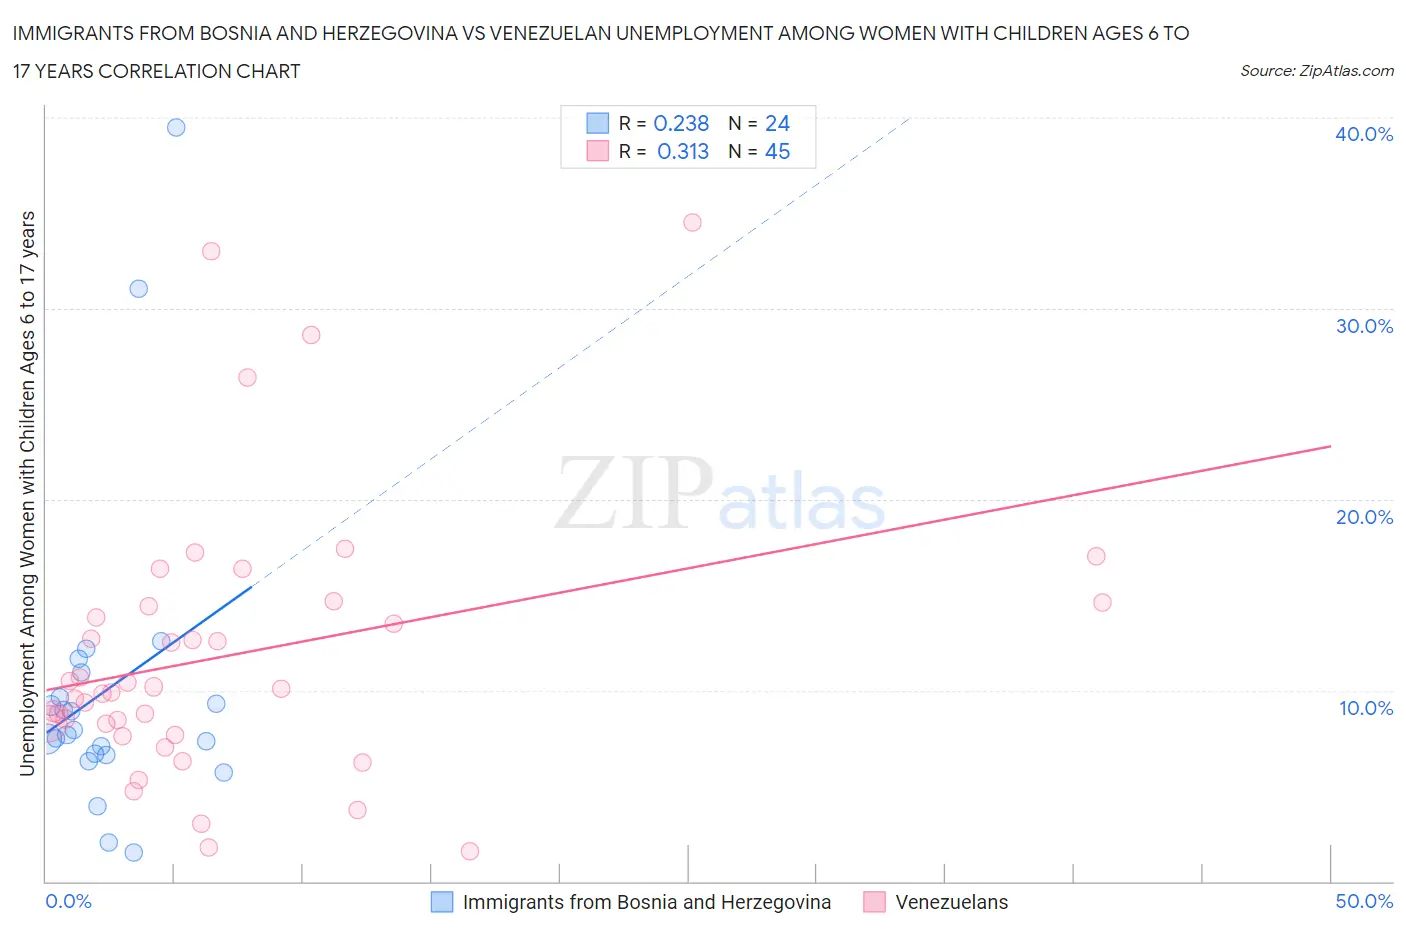
Immigrants from Bosnia and Herzegovina vs Venezuelan Unemployment Among Women with Children Ages 6 to 17 years Correlation Chart
The statistical analysis conducted on geographies consisting of 126,697,786 people shows a weak positive correlation between the proportion of Immigrants from Bosnia and Herzegovina and unemployment rate among women with children between the ages 6 and 17 in the United States with a correlation coefficient (R) of 0.238 and weighted average of 8.2%. Similarly, the statistical analysis conducted on geographies consisting of 232,836,093 people shows a mild positive correlation between the proportion of Venezuelans and unemployment rate among women with children between the ages 6 and 17 in the United States with a correlation coefficient (R) of 0.313 and weighted average of 10.2%, a difference of 24.5%.
Unemployment Among Women with Children Ages 6 to 17 years Correlation Summary
| Measurement | Immigrants from Bosnia and Herzegovina | Venezuelan |
| Minimum | 1.5% | 1.6% |
| Maximum | 39.5% | 34.5% |
| Range | 38.0% | 32.9% |
| Mean | 10.1% | 11.9% |
| Median | 7.8% | 10.1% |
| Interquartile 25% (IQ1) | 6.7% | 7.9% |
| Interquartile 75% (IQ3) | 10.3% | 14.5% |
| Interquartile Range (IQR) | 3.6% | 6.6% |
| Standard Deviation (Sample) | 8.3% | 7.2% |
| Standard Deviation (Population) | 8.2% | 7.1% |
Similar Demographics by Unemployment Among Women with Children Ages 6 to 17 years
Demographics Similar to Immigrants from Bosnia and Herzegovina by Unemployment Among Women with Children Ages 6 to 17 years
In terms of unemployment among women with children ages 6 to 17 years, the demographic groups most similar to Immigrants from Bosnia and Herzegovina are Immigrants from Japan (8.2%, a difference of 0.010%), Immigrants from Laos (8.2%, a difference of 0.020%), Immigrants from Armenia (8.2%, a difference of 0.070%), Immigrants from Malaysia (8.2%, a difference of 0.21%), and Immigrants from Philippines (8.2%, a difference of 0.28%).
| Demographics | Rating | Rank | Unemployment Among Women with Children Ages 6 to 17 years |
| Immigrants | Oceania | 100.0 /100 | #49 | Exceptional 8.1% |
| Hawaiians | 100.0 /100 | #50 | Exceptional 8.1% |
| Immigrants | Sudan | 100.0 /100 | #51 | Exceptional 8.1% |
| Immigrants | Iraq | 100.0 /100 | #52 | Exceptional 8.1% |
| Danes | 100.0 /100 | #53 | Exceptional 8.1% |
| Immigrants | Armenia | 100.0 /100 | #54 | Exceptional 8.2% |
| Immigrants | Japan | 100.0 /100 | #55 | Exceptional 8.2% |
| Immigrants | Bosnia and Herzegovina | 100.0 /100 | #56 | Exceptional 8.2% |
| Immigrants | Laos | 100.0 /100 | #57 | Exceptional 8.2% |
| Immigrants | Malaysia | 100.0 /100 | #58 | Exceptional 8.2% |
| Immigrants | Philippines | 100.0 /100 | #59 | Exceptional 8.2% |
| Basques | 100.0 /100 | #60 | Exceptional 8.2% |
| Koreans | 100.0 /100 | #61 | Exceptional 8.2% |
| Spanish American Indians | 100.0 /100 | #62 | Exceptional 8.2% |
| Immigrants | South Eastern Asia | 99.9 /100 | #63 | Exceptional 8.2% |
Demographics Similar to Venezuelans by Unemployment Among Women with Children Ages 6 to 17 years
In terms of unemployment among women with children ages 6 to 17 years, the demographic groups most similar to Venezuelans are Immigrants from Ecuador (10.2%, a difference of 0.17%), Immigrants from Venezuela (10.2%, a difference of 0.27%), Immigrants from Nigeria (10.2%, a difference of 0.32%), Immigrants from Bahamas (10.1%, a difference of 0.45%), and Nigerian (10.1%, a difference of 0.60%).
| Demographics | Rating | Rank | Unemployment Among Women with Children Ages 6 to 17 years |
| Cherokee | 0.0 /100 | #295 | Tragic 10.0% |
| Immigrants | Western Africa | 0.0 /100 | #296 | Tragic 10.1% |
| Immigrants | Caribbean | 0.0 /100 | #297 | Tragic 10.1% |
| Immigrants | Haiti | 0.0 /100 | #298 | Tragic 10.1% |
| Immigrants | Honduras | 0.0 /100 | #299 | Tragic 10.1% |
| Nigerians | 0.0 /100 | #300 | Tragic 10.1% |
| Immigrants | Bahamas | 0.0 /100 | #301 | Tragic 10.1% |
| Venezuelans | 0.0 /100 | #302 | Tragic 10.2% |
| Immigrants | Ecuador | 0.0 /100 | #303 | Tragic 10.2% |
| Immigrants | Venezuela | 0.0 /100 | #304 | Tragic 10.2% |
| Immigrants | Nigeria | 0.0 /100 | #305 | Tragic 10.2% |
| Paraguayans | 0.0 /100 | #306 | Tragic 10.2% |
| Immigrants | Senegal | 0.0 /100 | #307 | Tragic 10.2% |
| Dutch West Indians | 0.0 /100 | #308 | Tragic 10.2% |
| French Canadians | 0.0 /100 | #309 | Tragic 10.3% |