Immigrants from Bosnia and Herzegovina vs Venezuelan 9th Grade
COMPARE
Immigrants from Bosnia and Herzegovina
Venezuelan
9th Grade
9th Grade Comparison
Immigrants from Bosnia and Herzegovina
Venezuelans
95.2%
9TH GRADE
85.2/ 100
METRIC RATING
141st/ 347
METRIC RANK
95.0%
9TH GRADE
63.6/ 100
METRIC RATING
164th/ 347
METRIC RANK
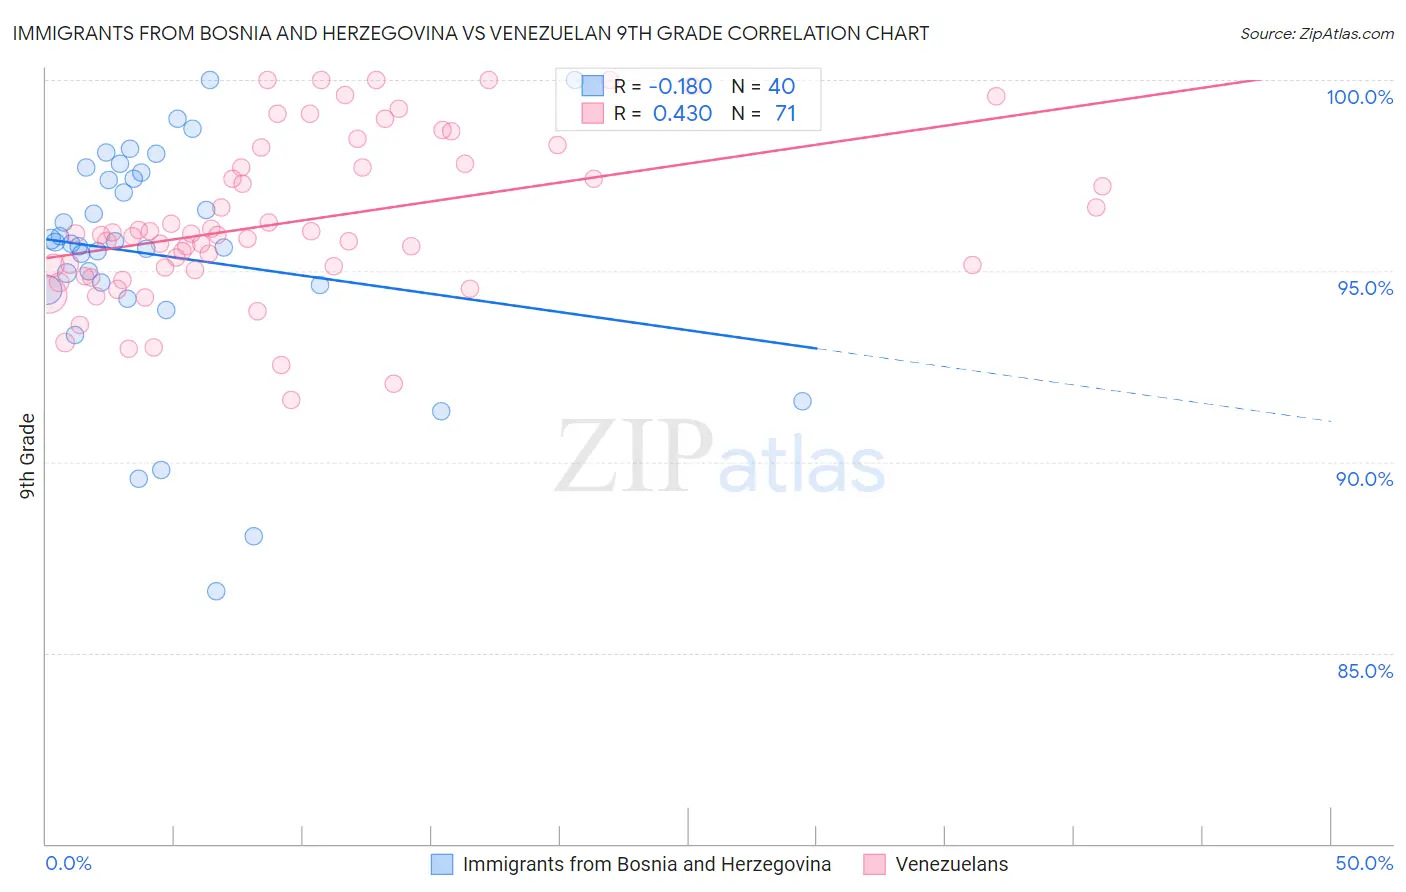
Immigrants from Bosnia and Herzegovina vs Venezuelan 9th Grade Correlation Chart
The statistical analysis conducted on geographies consisting of 156,819,615 people shows a poor negative correlation between the proportion of Immigrants from Bosnia and Herzegovina and percentage of population with at least 9th grade education in the United States with a correlation coefficient (R) of -0.180 and weighted average of 95.2%. Similarly, the statistical analysis conducted on geographies consisting of 306,323,638 people shows a moderate positive correlation between the proportion of Venezuelans and percentage of population with at least 9th grade education in the United States with a correlation coefficient (R) of 0.430 and weighted average of 95.0%, a difference of 0.22%.
9th Grade Correlation Summary
| Measurement | Immigrants from Bosnia and Herzegovina | Venezuelan |
| Minimum | 86.6% | 91.6% |
| Maximum | 100.0% | 100.0% |
| Range | 13.4% | 8.4% |
| Mean | 95.4% | 96.3% |
| Median | 95.7% | 95.9% |
| Interquartile 25% (IQ1) | 94.6% | 95.0% |
| Interquartile 75% (IQ3) | 97.5% | 97.8% |
| Interquartile Range (IQR) | 2.9% | 2.8% |
| Standard Deviation (Sample) | 3.0% | 2.1% |
| Standard Deviation (Population) | 3.0% | 2.1% |
Similar Demographics by 9th Grade
Demographics Similar to Immigrants from Bosnia and Herzegovina by 9th Grade
In terms of 9th grade, the demographic groups most similar to Immigrants from Bosnia and Herzegovina are Immigrants from Taiwan (95.2%, a difference of 0.0%), Immigrants from Eastern Europe (95.2%, a difference of 0.010%), Immigrants from Greece (95.2%, a difference of 0.010%), Spanish (95.2%, a difference of 0.010%), and Immigrants from Russia (95.2%, a difference of 0.020%).
| Demographics | Rating | Rank | 9th Grade |
| Immigrants | Israel | 89.6 /100 | #134 | Excellent 95.3% |
| Immigrants | Belarus | 88.9 /100 | #135 | Excellent 95.2% |
| Immigrants | Iran | 88.3 /100 | #136 | Excellent 95.2% |
| Hmong | 87.7 /100 | #137 | Excellent 95.2% |
| Immigrants | Russia | 86.6 /100 | #138 | Excellent 95.2% |
| Immigrants | Eastern Europe | 85.8 /100 | #139 | Excellent 95.2% |
| Immigrants | Taiwan | 85.3 /100 | #140 | Excellent 95.2% |
| Immigrants | Bosnia and Herzegovina | 85.2 /100 | #141 | Excellent 95.2% |
| Immigrants | Greece | 84.6 /100 | #142 | Excellent 95.2% |
| Spanish | 84.4 /100 | #143 | Excellent 95.2% |
| Yup'ik | 83.3 /100 | #144 | Excellent 95.2% |
| Pueblo | 82.2 /100 | #145 | Excellent 95.1% |
| Immigrants | Sri Lanka | 82.1 /100 | #146 | Excellent 95.1% |
| Choctaw | 81.9 /100 | #147 | Excellent 95.1% |
| Immigrants | Jordan | 81.2 /100 | #148 | Excellent 95.1% |
Demographics Similar to Venezuelans by 9th Grade
In terms of 9th grade, the demographic groups most similar to Venezuelans are Pakistani (95.0%, a difference of 0.0%), Blackfeet (95.0%, a difference of 0.010%), Ute (95.0%, a difference of 0.010%), Immigrants from Italy (95.0%, a difference of 0.020%), and French American Indian (95.0%, a difference of 0.020%).
| Demographics | Rating | Rank | 9th Grade |
| Mongolians | 73.0 /100 | #157 | Good 95.0% |
| Egyptians | 70.1 /100 | #158 | Good 95.0% |
| Immigrants | Ukraine | 67.4 /100 | #159 | Good 95.0% |
| Immigrants | Italy | 66.6 /100 | #160 | Good 95.0% |
| French American Indians | 66.5 /100 | #161 | Good 95.0% |
| Bermudans | 65.8 /100 | #162 | Good 95.0% |
| Pakistanis | 64.1 /100 | #163 | Good 95.0% |
| Venezuelans | 63.6 /100 | #164 | Good 95.0% |
| Blackfeet | 62.6 /100 | #165 | Good 95.0% |
| Ute | 62.6 /100 | #166 | Good 95.0% |
| Immigrants | Brazil | 61.1 /100 | #167 | Good 95.0% |
| Chileans | 60.7 /100 | #168 | Good 95.0% |
| Spaniards | 59.6 /100 | #169 | Average 94.9% |
| Alsatians | 58.6 /100 | #170 | Average 94.9% |
| Colville | 58.5 /100 | #171 | Average 94.9% |