Slovene vs Venezuelan Unemployment Among Women with Children Ages 6 to 17 years
COMPARE
Slovene
Venezuelan
Unemployment Among Women with Children Ages 6 to 17 years
Unemployment Among Women with Children Ages 6 to 17 years Comparison
Slovenes
Venezuelans
9.1%
UNEMPLOYMENT AMONG WOMEN WITH CHILDREN AGES 6 TO 17 YEARS
28.5/ 100
METRIC RATING
190th/ 347
METRIC RANK
10.2%
UNEMPLOYMENT AMONG WOMEN WITH CHILDREN AGES 6 TO 17 YEARS
0.0/ 100
METRIC RATING
302nd/ 347
METRIC RANK
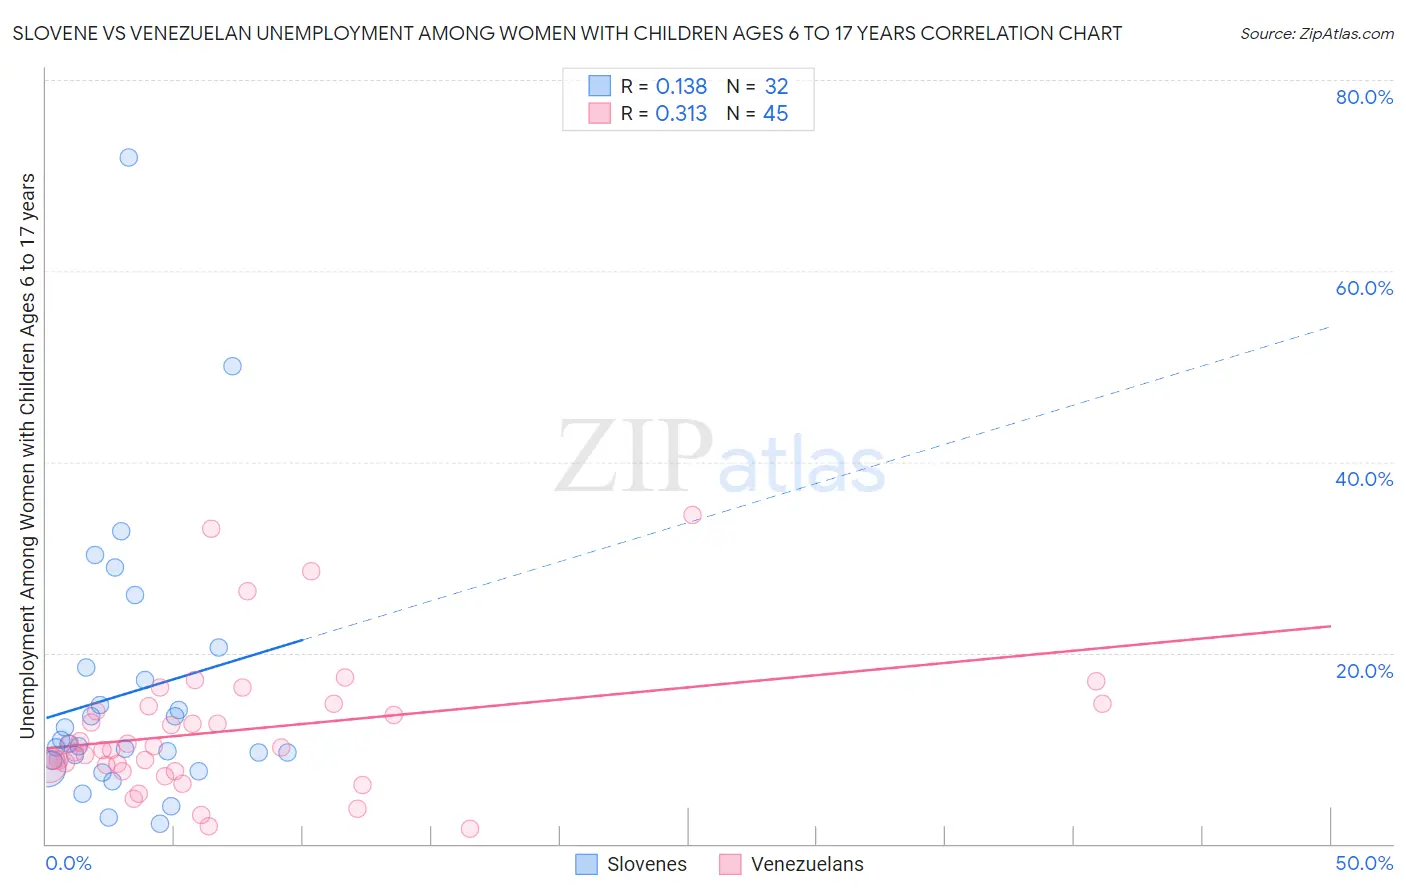
Slovene vs Venezuelan Unemployment Among Women with Children Ages 6 to 17 years Correlation Chart
The statistical analysis conducted on geographies consisting of 193,849,840 people shows a poor positive correlation between the proportion of Slovenes and unemployment rate among women with children between the ages 6 and 17 in the United States with a correlation coefficient (R) of 0.138 and weighted average of 9.1%. Similarly, the statistical analysis conducted on geographies consisting of 232,836,093 people shows a mild positive correlation between the proportion of Venezuelans and unemployment rate among women with children between the ages 6 and 17 in the United States with a correlation coefficient (R) of 0.313 and weighted average of 10.2%, a difference of 12.2%.
Unemployment Among Women with Children Ages 6 to 17 years Correlation Summary
| Measurement | Slovene | Venezuelan |
| Minimum | 2.1% | 1.6% |
| Maximum | 71.9% | 34.5% |
| Range | 69.8% | 32.9% |
| Mean | 15.8% | 11.9% |
| Median | 10.4% | 10.1% |
| Interquartile 25% (IQ1) | 8.3% | 7.9% |
| Interquartile 75% (IQ3) | 17.8% | 14.5% |
| Interquartile Range (IQR) | 9.5% | 6.6% |
| Standard Deviation (Sample) | 14.4% | 7.2% |
| Standard Deviation (Population) | 14.2% | 7.1% |
Similar Demographics by Unemployment Among Women with Children Ages 6 to 17 years
Demographics Similar to Slovenes by Unemployment Among Women with Children Ages 6 to 17 years
In terms of unemployment among women with children ages 6 to 17 years, the demographic groups most similar to Slovenes are Belizean (9.1%, a difference of 0.0%), Immigrants (9.1%, a difference of 0.040%), Immigrants from Syria (9.1%, a difference of 0.070%), Guamanian/Chamorro (9.1%, a difference of 0.070%), and Comanche (9.0%, a difference of 0.080%).
| Demographics | Rating | Rank | Unemployment Among Women with Children Ages 6 to 17 years |
| Swiss | 33.5 /100 | #183 | Fair 9.0% |
| Palestinians | 33.4 /100 | #184 | Fair 9.0% |
| Immigrants | Congo | 32.5 /100 | #185 | Fair 9.0% |
| Immigrants | Spain | 32.4 /100 | #186 | Fair 9.0% |
| Comanche | 30.0 /100 | #187 | Fair 9.0% |
| Immigrants | Syria | 29.7 /100 | #188 | Fair 9.1% |
| Immigrants | Immigrants | 29.2 /100 | #189 | Fair 9.1% |
| Slovenes | 28.5 /100 | #190 | Fair 9.1% |
| Belizeans | 28.4 /100 | #191 | Fair 9.1% |
| Guamanians/Chamorros | 27.2 /100 | #192 | Fair 9.1% |
| Immigrants | Turkey | 25.8 /100 | #193 | Fair 9.1% |
| Immigrants | Kazakhstan | 25.3 /100 | #194 | Fair 9.1% |
| Austrians | 25.0 /100 | #195 | Fair 9.1% |
| Brazilians | 24.4 /100 | #196 | Fair 9.1% |
| Immigrants | Panama | 24.3 /100 | #197 | Fair 9.1% |
Demographics Similar to Venezuelans by Unemployment Among Women with Children Ages 6 to 17 years
In terms of unemployment among women with children ages 6 to 17 years, the demographic groups most similar to Venezuelans are Immigrants from Ecuador (10.2%, a difference of 0.17%), Immigrants from Venezuela (10.2%, a difference of 0.27%), Immigrants from Nigeria (10.2%, a difference of 0.32%), Immigrants from Bahamas (10.1%, a difference of 0.45%), and Nigerian (10.1%, a difference of 0.60%).
| Demographics | Rating | Rank | Unemployment Among Women with Children Ages 6 to 17 years |
| Cherokee | 0.0 /100 | #295 | Tragic 10.0% |
| Immigrants | Western Africa | 0.0 /100 | #296 | Tragic 10.1% |
| Immigrants | Caribbean | 0.0 /100 | #297 | Tragic 10.1% |
| Immigrants | Haiti | 0.0 /100 | #298 | Tragic 10.1% |
| Immigrants | Honduras | 0.0 /100 | #299 | Tragic 10.1% |
| Nigerians | 0.0 /100 | #300 | Tragic 10.1% |
| Immigrants | Bahamas | 0.0 /100 | #301 | Tragic 10.1% |
| Venezuelans | 0.0 /100 | #302 | Tragic 10.2% |
| Immigrants | Ecuador | 0.0 /100 | #303 | Tragic 10.2% |
| Immigrants | Venezuela | 0.0 /100 | #304 | Tragic 10.2% |
| Immigrants | Nigeria | 0.0 /100 | #305 | Tragic 10.2% |
| Paraguayans | 0.0 /100 | #306 | Tragic 10.2% |
| Immigrants | Senegal | 0.0 /100 | #307 | Tragic 10.2% |
| Dutch West Indians | 0.0 /100 | #308 | Tragic 10.2% |
| French Canadians | 0.0 /100 | #309 | Tragic 10.3% |