Cree vs Venezuelan Unemployment Among Women with Children Ages 6 to 17 years
COMPARE
Cree
Venezuelan
Unemployment Among Women with Children Ages 6 to 17 years
Unemployment Among Women with Children Ages 6 to 17 years Comparison
Cree
Venezuelans
10.8%
UNEMPLOYMENT AMONG WOMEN WITH CHILDREN AGES 6 TO 17 YEARS
0.0/ 100
METRIC RATING
322nd/ 347
METRIC RANK
10.2%
UNEMPLOYMENT AMONG WOMEN WITH CHILDREN AGES 6 TO 17 YEARS
0.0/ 100
METRIC RATING
302nd/ 347
METRIC RANK
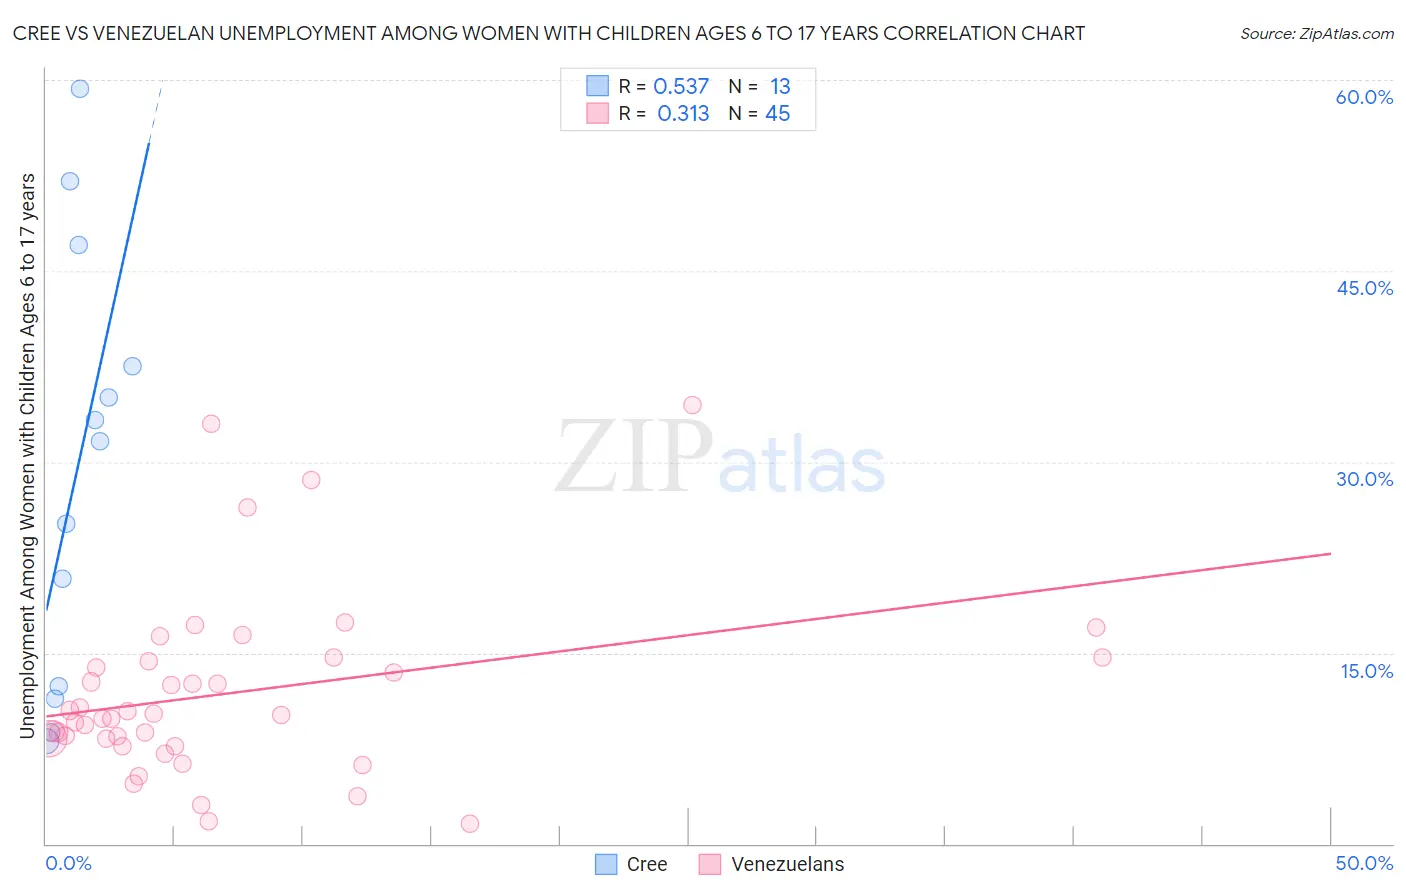
Cree vs Venezuelan Unemployment Among Women with Children Ages 6 to 17 years Correlation Chart
The statistical analysis conducted on geographies consisting of 67,879,761 people shows a substantial positive correlation between the proportion of Cree and unemployment rate among women with children between the ages 6 and 17 in the United States with a correlation coefficient (R) of 0.537 and weighted average of 10.8%. Similarly, the statistical analysis conducted on geographies consisting of 232,836,093 people shows a mild positive correlation between the proportion of Venezuelans and unemployment rate among women with children between the ages 6 and 17 in the United States with a correlation coefficient (R) of 0.313 and weighted average of 10.2%, a difference of 6.4%.
Unemployment Among Women with Children Ages 6 to 17 years Correlation Summary
| Measurement | Cree | Venezuelan |
| Minimum | 8.1% | 1.6% |
| Maximum | 59.3% | 34.5% |
| Range | 51.3% | 32.9% |
| Mean | 29.4% | 11.9% |
| Median | 31.6% | 10.1% |
| Interquartile 25% (IQ1) | 11.9% | 7.9% |
| Interquartile 75% (IQ3) | 42.3% | 14.5% |
| Interquartile Range (IQR) | 30.4% | 6.6% |
| Standard Deviation (Sample) | 16.9% | 7.2% |
| Standard Deviation (Population) | 16.2% | 7.1% |
Demographics Similar to Cree and Venezuelans by Unemployment Among Women with Children Ages 6 to 17 years
In terms of unemployment among women with children ages 6 to 17 years, the demographic groups most similar to Cree are Tohono O'odham (10.7%, a difference of 1.3%), Apache (10.7%, a difference of 1.5%), Immigrants from Uganda (10.7%, a difference of 1.5%), Delaware (10.5%, a difference of 2.8%), and Bermudan (10.5%, a difference of 2.8%). Similarly, the demographic groups most similar to Venezuelans are Immigrants from Ecuador (10.2%, a difference of 0.17%), Immigrants from Venezuela (10.2%, a difference of 0.27%), Immigrants from Nigeria (10.2%, a difference of 0.32%), Paraguayan (10.2%, a difference of 0.61%), and Immigrants from Senegal (10.2%, a difference of 0.84%).
| Demographics | Rating | Rank | Unemployment Among Women with Children Ages 6 to 17 years |
| Venezuelans | 0.0 /100 | #302 | Tragic 10.2% |
| Immigrants | Ecuador | 0.0 /100 | #303 | Tragic 10.2% |
| Immigrants | Venezuela | 0.0 /100 | #304 | Tragic 10.2% |
| Immigrants | Nigeria | 0.0 /100 | #305 | Tragic 10.2% |
| Paraguayans | 0.0 /100 | #306 | Tragic 10.2% |
| Immigrants | Senegal | 0.0 /100 | #307 | Tragic 10.2% |
| Dutch West Indians | 0.0 /100 | #308 | Tragic 10.2% |
| French Canadians | 0.0 /100 | #309 | Tragic 10.3% |
| Alaska Natives | 0.0 /100 | #310 | Tragic 10.3% |
| Immigrants | Liberia | 0.0 /100 | #311 | Tragic 10.3% |
| Africans | 0.0 /100 | #312 | Tragic 10.4% |
| Americans | 0.0 /100 | #313 | Tragic 10.4% |
| Immigrants | Cabo Verde | 0.0 /100 | #314 | Tragic 10.4% |
| Bahamians | 0.0 /100 | #315 | Tragic 10.4% |
| Immigrants | Dominica | 0.0 /100 | #316 | Tragic 10.5% |
| Bermudans | 0.0 /100 | #317 | Tragic 10.5% |
| Delaware | 0.0 /100 | #318 | Tragic 10.5% |
| Immigrants | Uganda | 0.0 /100 | #319 | Tragic 10.7% |
| Apache | 0.0 /100 | #320 | Tragic 10.7% |
| Tohono O'odham | 0.0 /100 | #321 | Tragic 10.7% |
| Cree | 0.0 /100 | #322 | Tragic 10.8% |