Immigrants from Belize vs Immigrants from Bosnia and Herzegovina Unemployment Among Ages 55 to 59 years
COMPARE
Immigrants from Belize
Immigrants from Bosnia and Herzegovina
Unemployment Among Ages 55 to 59 years
Unemployment Among Ages 55 to 59 years Comparison
Immigrants from Belize
Immigrants from Bosnia and Herzegovina
5.5%
UNEMPLOYMENT AMONG AGES 55 TO 59 YEARS
0.0/ 100
METRIC RATING
307th/ 347
METRIC RANK
4.6%
UNEMPLOYMENT AMONG AGES 55 TO 59 YEARS
98.3/ 100
METRIC RATING
76th/ 347
METRIC RANK
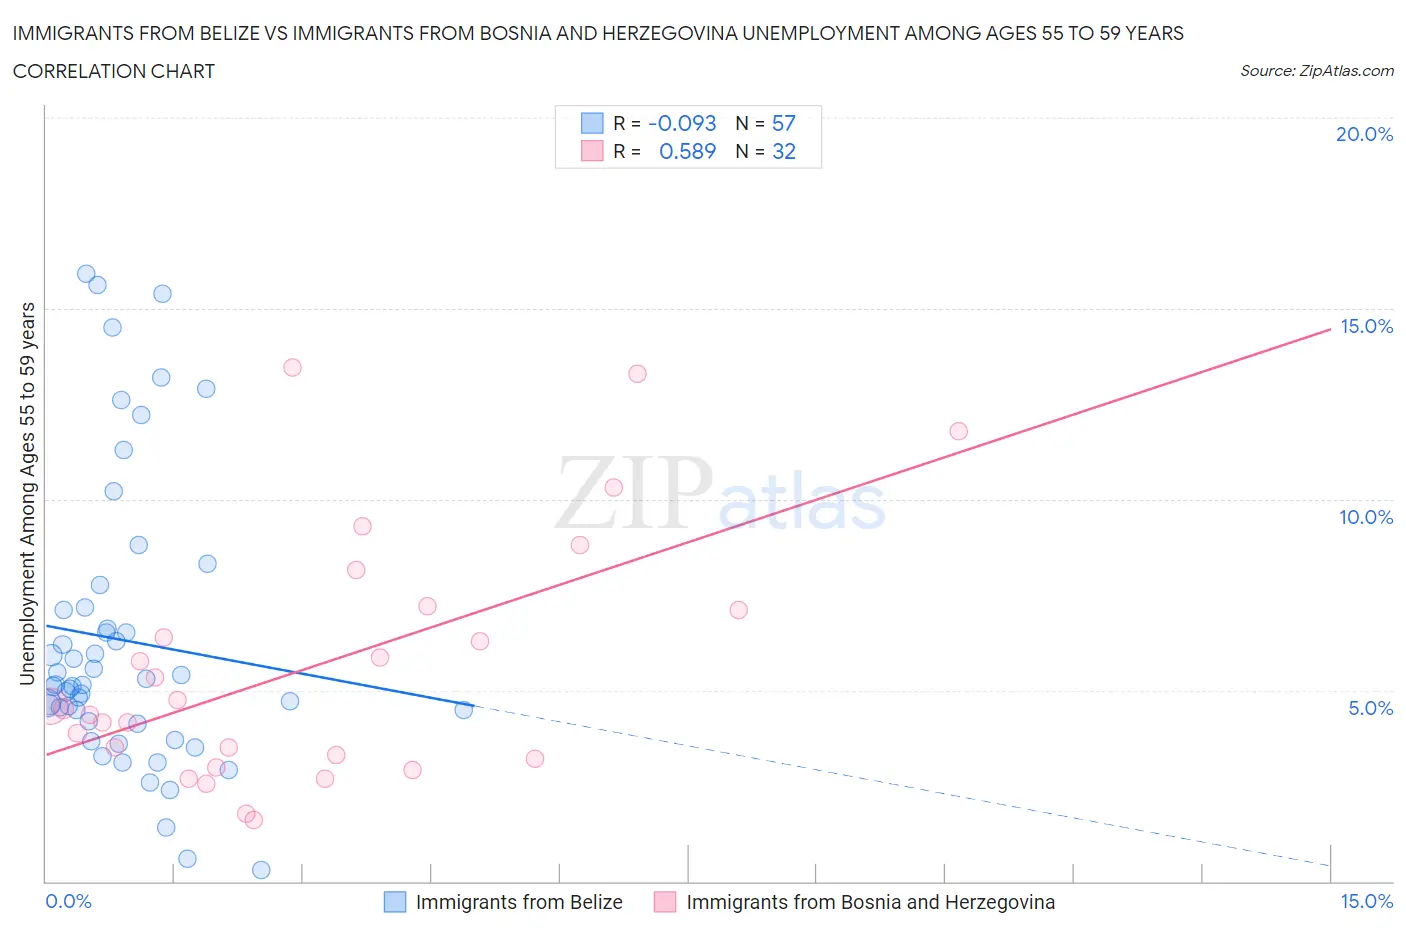
Immigrants from Belize vs Immigrants from Bosnia and Herzegovina Unemployment Among Ages 55 to 59 years Correlation Chart
The statistical analysis conducted on geographies consisting of 127,651,954 people shows a slight negative correlation between the proportion of Immigrants from Belize and unemployment rate among population between the ages 55 and 59 in the United States with a correlation coefficient (R) of -0.093 and weighted average of 5.5%. Similarly, the statistical analysis conducted on geographies consisting of 151,718,135 people shows a substantial positive correlation between the proportion of Immigrants from Bosnia and Herzegovina and unemployment rate among population between the ages 55 and 59 in the United States with a correlation coefficient (R) of 0.589 and weighted average of 4.6%, a difference of 19.7%.
Unemployment Among Ages 55 to 59 years Correlation Summary
| Measurement | Immigrants from Belize | Immigrants from Bosnia and Herzegovina |
| Minimum | 0.30% | 1.6% |
| Maximum | 15.9% | 13.4% |
| Range | 15.6% | 11.9% |
| Mean | 6.3% | 5.6% |
| Median | 5.1% | 4.5% |
| Interquartile 25% (IQ1) | 4.2% | 3.3% |
| Interquartile 75% (IQ3) | 7.1% | 7.2% |
| Interquartile Range (IQR) | 3.0% | 3.9% |
| Standard Deviation (Sample) | 3.7% | 3.2% |
| Standard Deviation (Population) | 3.7% | 3.2% |
Similar Demographics by Unemployment Among Ages 55 to 59 years
Demographics Similar to Immigrants from Belize by Unemployment Among Ages 55 to 59 years
In terms of unemployment among ages 55 to 59 years, the demographic groups most similar to Immigrants from Belize are Immigrants from Cabo Verde (5.5%, a difference of 0.22%), Immigrants from Portugal (5.5%, a difference of 0.34%), Spanish American Indian (5.6%, a difference of 0.50%), Black/African American (5.5%, a difference of 0.51%), and Sierra Leonean (5.5%, a difference of 1.0%).
| Demographics | Rating | Rank | Unemployment Among Ages 55 to 59 years |
| Immigrants | St. Vincent and the Grenadines | 0.0 /100 | #300 | Tragic 5.4% |
| Immigrants | Dominica | 0.0 /100 | #301 | Tragic 5.5% |
| Sierra Leoneans | 0.0 /100 | #302 | Tragic 5.5% |
| Marshallese | 0.0 /100 | #303 | Tragic 5.5% |
| Blacks/African Americans | 0.0 /100 | #304 | Tragic 5.5% |
| Immigrants | Portugal | 0.0 /100 | #305 | Tragic 5.5% |
| Immigrants | Cabo Verde | 0.0 /100 | #306 | Tragic 5.5% |
| Immigrants | Belize | 0.0 /100 | #307 | Tragic 5.5% |
| Spanish American Indians | 0.0 /100 | #308 | Tragic 5.6% |
| Nepalese | 0.0 /100 | #309 | Tragic 5.6% |
| Belizeans | 0.0 /100 | #310 | Tragic 5.6% |
| Houma | 0.0 /100 | #311 | Tragic 5.6% |
| Ecuadorians | 0.0 /100 | #312 | Tragic 5.6% |
| Central American Indians | 0.0 /100 | #313 | Tragic 5.6% |
| Tlingit-Haida | 0.0 /100 | #314 | Tragic 5.7% |
Demographics Similar to Immigrants from Bosnia and Herzegovina by Unemployment Among Ages 55 to 59 years
In terms of unemployment among ages 55 to 59 years, the demographic groups most similar to Immigrants from Bosnia and Herzegovina are Scotch-Irish (4.6%, a difference of 0.010%), Finnish (4.6%, a difference of 0.060%), Immigrants from Iraq (4.6%, a difference of 0.070%), Croatian (4.6%, a difference of 0.090%), and Sri Lankan (4.6%, a difference of 0.15%).
| Demographics | Rating | Rank | Unemployment Among Ages 55 to 59 years |
| Czechoslovakians | 99.0 /100 | #69 | Exceptional 4.6% |
| Filipinos | 98.8 /100 | #70 | Exceptional 4.6% |
| Immigrants | Jordan | 98.7 /100 | #71 | Exceptional 4.6% |
| Immigrants | Taiwan | 98.7 /100 | #72 | Exceptional 4.6% |
| Bhutanese | 98.6 /100 | #73 | Exceptional 4.6% |
| Croatians | 98.5 /100 | #74 | Exceptional 4.6% |
| Immigrants | Iraq | 98.5 /100 | #75 | Exceptional 4.6% |
| Immigrants | Bosnia and Herzegovina | 98.3 /100 | #76 | Exceptional 4.6% |
| Scotch-Irish | 98.3 /100 | #77 | Exceptional 4.6% |
| Finns | 98.2 /100 | #78 | Exceptional 4.6% |
| Sri Lankans | 98.1 /100 | #79 | Exceptional 4.6% |
| Cambodians | 98.0 /100 | #80 | Exceptional 4.6% |
| Taiwanese | 97.9 /100 | #81 | Exceptional 4.6% |
| Latvians | 97.8 /100 | #82 | Exceptional 4.6% |
| Lebanese | 97.5 /100 | #83 | Exceptional 4.6% |