Immigrants from Albania vs Immigrants from Iran Unemployment Among Ages 55 to 59 years
COMPARE
Immigrants from Albania
Immigrants from Iran
Unemployment Among Ages 55 to 59 years
Unemployment Among Ages 55 to 59 years Comparison
Immigrants from Albania
Immigrants from Iran
5.0%
UNEMPLOYMENT AMONG AGES 55 TO 59 YEARS
1.3/ 100
METRIC RATING
236th/ 347
METRIC RANK
5.0%
UNEMPLOYMENT AMONG AGES 55 TO 59 YEARS
3.7/ 100
METRIC RATING
227th/ 347
METRIC RANK
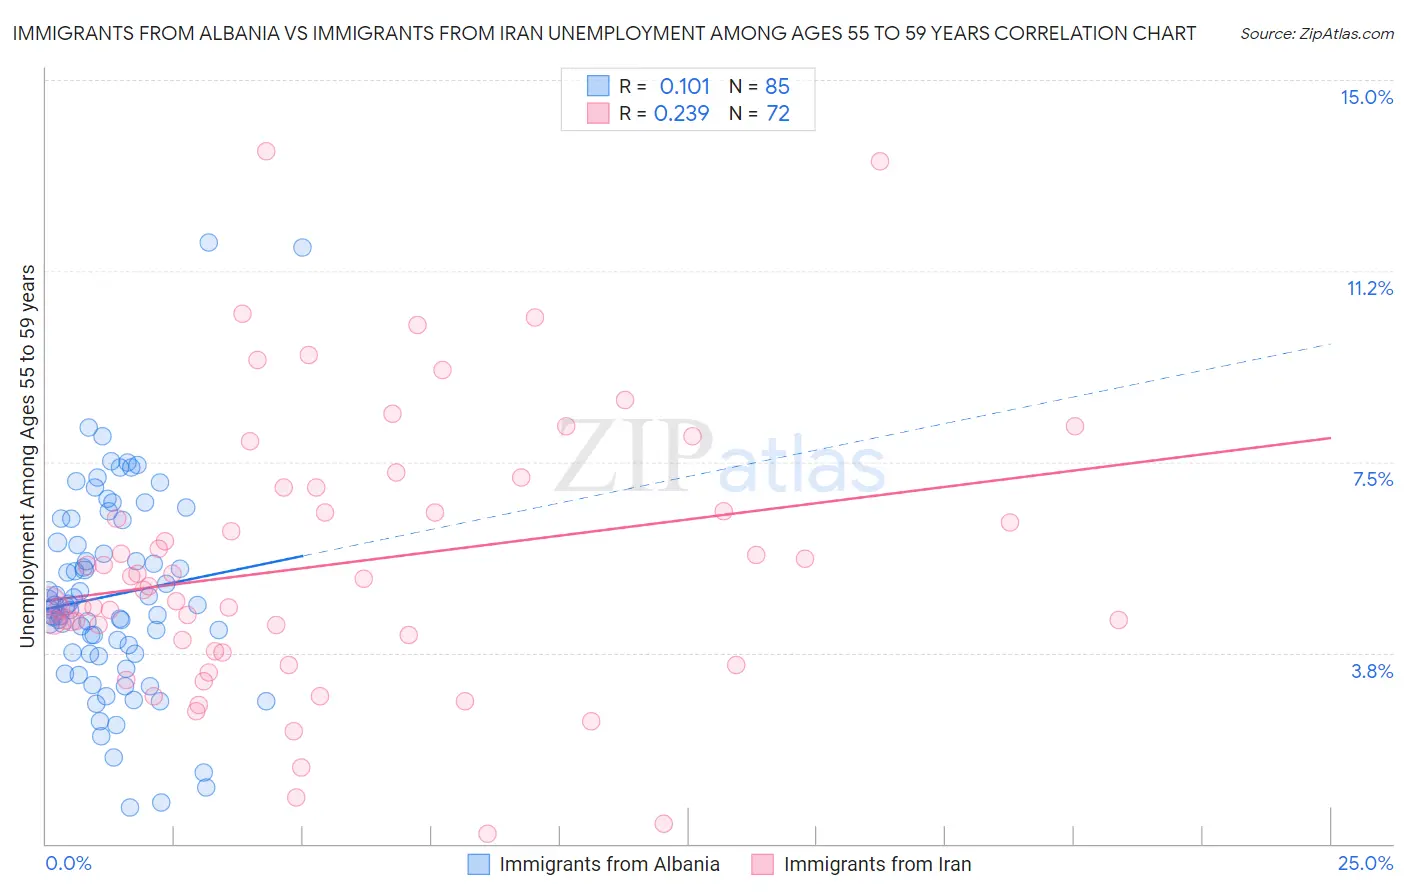
Immigrants from Albania vs Immigrants from Iran Unemployment Among Ages 55 to 59 years Correlation Chart
The statistical analysis conducted on geographies consisting of 116,731,137 people shows a poor positive correlation between the proportion of Immigrants from Albania and unemployment rate among population between the ages 55 and 59 in the United States with a correlation coefficient (R) of 0.101 and weighted average of 5.0%. Similarly, the statistical analysis conducted on geographies consisting of 268,472,905 people shows a weak positive correlation between the proportion of Immigrants from Iran and unemployment rate among population between the ages 55 and 59 in the United States with a correlation coefficient (R) of 0.239 and weighted average of 5.0%, a difference of 1.1%.
Unemployment Among Ages 55 to 59 years Correlation Summary
| Measurement | Immigrants from Albania | Immigrants from Iran |
| Minimum | 0.70% | 0.20% |
| Maximum | 11.8% | 13.6% |
| Range | 11.1% | 13.4% |
| Mean | 4.9% | 5.5% |
| Median | 4.7% | 5.0% |
| Interquartile 25% (IQ1) | 3.7% | 3.9% |
| Interquartile 75% (IQ3) | 6.1% | 6.8% |
| Interquartile Range (IQR) | 2.4% | 2.9% |
| Standard Deviation (Sample) | 2.0% | 2.7% |
| Standard Deviation (Population) | 2.0% | 2.6% |
Demographics Similar to Immigrants from Albania and Immigrants from Iran by Unemployment Among Ages 55 to 59 years
In terms of unemployment among ages 55 to 59 years, the demographic groups most similar to Immigrants from Albania are Choctaw (5.0%, a difference of 0.010%), Moroccan (5.0%, a difference of 0.030%), French American Indian (5.0%, a difference of 0.040%), Immigrants from Hong Kong (5.0%, a difference of 0.11%), and Immigrants from Costa Rica (5.0%, a difference of 0.17%). Similarly, the demographic groups most similar to Immigrants from Iran are Immigrants from China (5.0%, a difference of 0.13%), Immigrants from Liberia (5.0%, a difference of 0.13%), Costa Rican (5.0%, a difference of 0.18%), Subsaharan African (5.0%, a difference of 0.19%), and Immigrants from Western Asia (5.0%, a difference of 0.21%).
| Demographics | Rating | Rank | Unemployment Among Ages 55 to 59 years |
| Nigerians | 7.5 /100 | #221 | Tragic 4.9% |
| Spanish | 5.1 /100 | #222 | Tragic 5.0% |
| Immigrants | Ireland | 4.8 /100 | #223 | Tragic 5.0% |
| Sub-Saharan Africans | 4.4 /100 | #224 | Tragic 5.0% |
| Costa Ricans | 4.4 /100 | #225 | Tragic 5.0% |
| Immigrants | China | 4.2 /100 | #226 | Tragic 5.0% |
| Immigrants | Iran | 3.7 /100 | #227 | Tragic 5.0% |
| Immigrants | Liberia | 3.2 /100 | #228 | Tragic 5.0% |
| Immigrants | Western Asia | 3.0 /100 | #229 | Tragic 5.0% |
| Immigrants | Syria | 2.7 /100 | #230 | Tragic 5.0% |
| Cherokee | 2.6 /100 | #231 | Tragic 5.0% |
| Albanians | 2.5 /100 | #232 | Tragic 5.0% |
| Immigrants | Immigrants | 2.3 /100 | #233 | Tragic 5.0% |
| Immigrants | Southern Europe | 1.8 /100 | #234 | Tragic 5.0% |
| Immigrants | Hong Kong | 1.4 /100 | #235 | Tragic 5.0% |
| Immigrants | Albania | 1.3 /100 | #236 | Tragic 5.0% |
| Choctaw | 1.3 /100 | #237 | Tragic 5.0% |
| Moroccans | 1.3 /100 | #238 | Tragic 5.0% |
| French American Indians | 1.2 /100 | #239 | Tragic 5.0% |
| Immigrants | Costa Rica | 1.1 /100 | #240 | Tragic 5.0% |
| Brazilians | 1.0 /100 | #241 | Tragic 5.0% |