Immigrants from Belize vs Trinidadian and Tobagonian Unemployment Among Ages 55 to 59 years
COMPARE
Immigrants from Belize
Trinidadian and Tobagonian
Unemployment Among Ages 55 to 59 years
Unemployment Among Ages 55 to 59 years Comparison
Immigrants from Belize
Trinidadians and Tobagonians
5.5%
UNEMPLOYMENT AMONG AGES 55 TO 59 YEARS
0.0/ 100
METRIC RATING
307th/ 347
METRIC RANK
5.3%
UNEMPLOYMENT AMONG AGES 55 TO 59 YEARS
0.0/ 100
METRIC RATING
291st/ 347
METRIC RANK
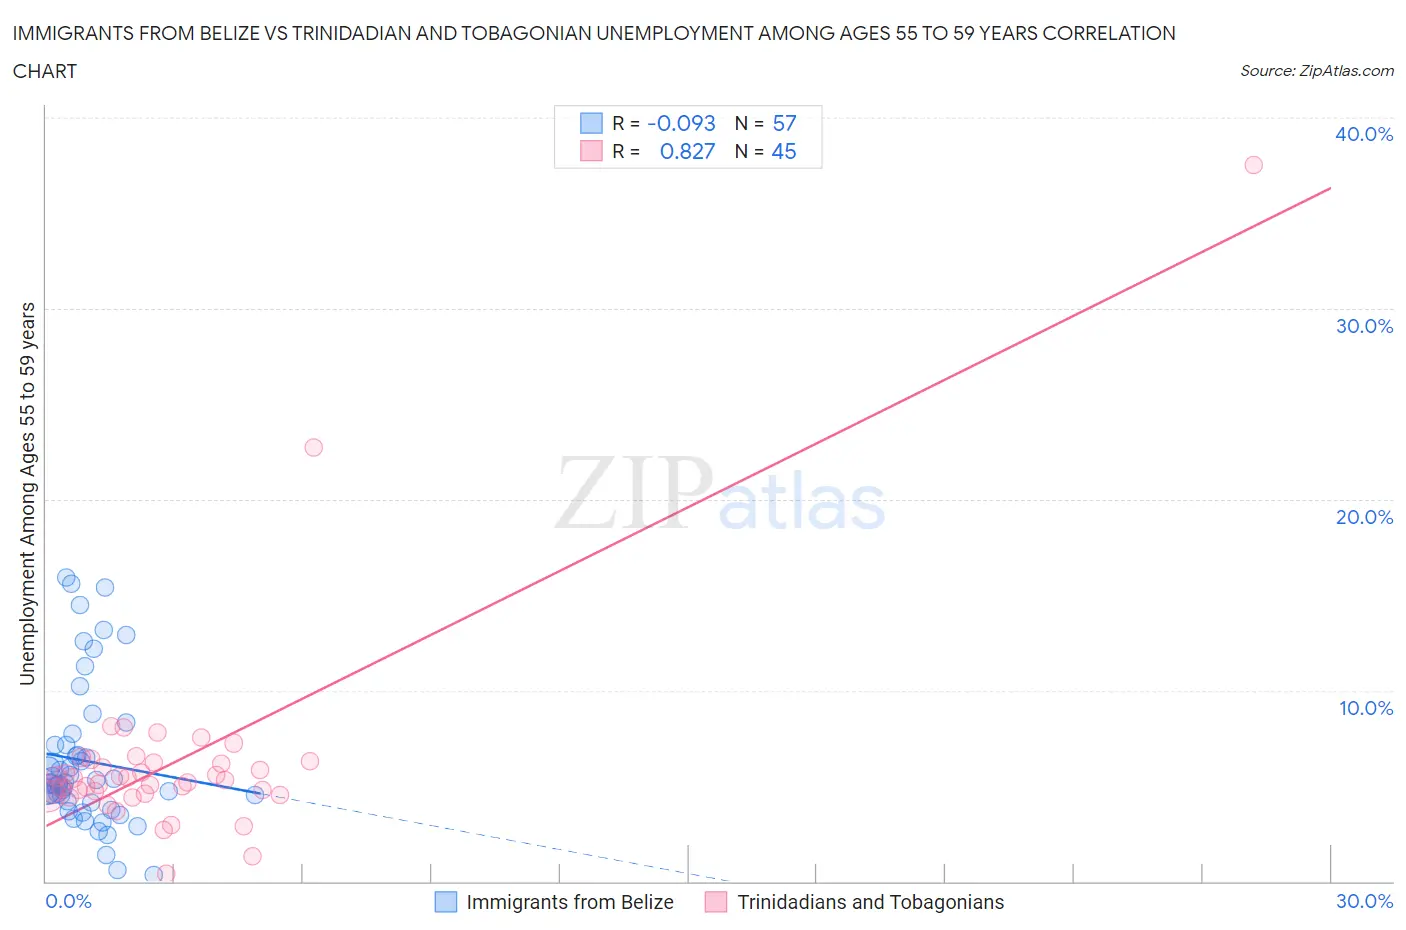
Immigrants from Belize vs Trinidadian and Tobagonian Unemployment Among Ages 55 to 59 years Correlation Chart
The statistical analysis conducted on geographies consisting of 127,651,954 people shows a slight negative correlation between the proportion of Immigrants from Belize and unemployment rate among population between the ages 55 and 59 in the United States with a correlation coefficient (R) of -0.093 and weighted average of 5.5%. Similarly, the statistical analysis conducted on geographies consisting of 211,643,206 people shows a very strong positive correlation between the proportion of Trinidadians and Tobagonians and unemployment rate among population between the ages 55 and 59 in the United States with a correlation coefficient (R) of 0.827 and weighted average of 5.3%, a difference of 4.3%.
Unemployment Among Ages 55 to 59 years Correlation Summary
| Measurement | Immigrants from Belize | Trinidadian and Tobagonian |
| Minimum | 0.30% | 0.40% |
| Maximum | 15.9% | 37.5% |
| Range | 15.6% | 37.1% |
| Mean | 6.3% | 6.3% |
| Median | 5.1% | 5.3% |
| Interquartile 25% (IQ1) | 4.2% | 4.6% |
| Interquartile 75% (IQ3) | 7.1% | 6.3% |
| Interquartile Range (IQR) | 3.0% | 1.7% |
| Standard Deviation (Sample) | 3.7% | 5.6% |
| Standard Deviation (Population) | 3.7% | 5.6% |
Demographics Similar to Immigrants from Belize and Trinidadians and Tobagonians by Unemployment Among Ages 55 to 59 years
In terms of unemployment among ages 55 to 59 years, the demographic groups most similar to Immigrants from Belize are Immigrants from Cabo Verde (5.5%, a difference of 0.22%), Immigrants from Portugal (5.5%, a difference of 0.34%), Spanish American Indian (5.6%, a difference of 0.50%), Black/African American (5.5%, a difference of 0.51%), and Sierra Leonean (5.5%, a difference of 1.0%). Similarly, the demographic groups most similar to Trinidadians and Tobagonians are Sioux (5.3%, a difference of 0.070%), Immigrants from Central America (5.3%, a difference of 0.10%), British West Indian (5.3%, a difference of 0.14%), Immigrants from Grenada (5.3%, a difference of 0.33%), and Cajun (5.3%, a difference of 0.45%).
| Demographics | Rating | Rank | Unemployment Among Ages 55 to 59 years |
| Immigrants | Central America | 0.0 /100 | #289 | Tragic 5.3% |
| Sioux | 0.0 /100 | #290 | Tragic 5.3% |
| Trinidadians and Tobagonians | 0.0 /100 | #291 | Tragic 5.3% |
| British West Indians | 0.0 /100 | #292 | Tragic 5.3% |
| Immigrants | Grenada | 0.0 /100 | #293 | Tragic 5.3% |
| Cajuns | 0.0 /100 | #294 | Tragic 5.3% |
| Dutch West Indians | 0.0 /100 | #295 | Tragic 5.3% |
| Barbadians | 0.0 /100 | #296 | Tragic 5.3% |
| Immigrants | Mexico | 0.0 /100 | #297 | Tragic 5.3% |
| Hispanics or Latinos | 0.0 /100 | #298 | Tragic 5.4% |
| Cape Verdeans | 0.0 /100 | #299 | Tragic 5.4% |
| Immigrants | St. Vincent and the Grenadines | 0.0 /100 | #300 | Tragic 5.4% |
| Immigrants | Dominica | 0.0 /100 | #301 | Tragic 5.5% |
| Sierra Leoneans | 0.0 /100 | #302 | Tragic 5.5% |
| Marshallese | 0.0 /100 | #303 | Tragic 5.5% |
| Blacks/African Americans | 0.0 /100 | #304 | Tragic 5.5% |
| Immigrants | Portugal | 0.0 /100 | #305 | Tragic 5.5% |
| Immigrants | Cabo Verde | 0.0 /100 | #306 | Tragic 5.5% |
| Immigrants | Belize | 0.0 /100 | #307 | Tragic 5.5% |
| Spanish American Indians | 0.0 /100 | #308 | Tragic 5.6% |
| Nepalese | 0.0 /100 | #309 | Tragic 5.6% |