Immigrants from Belize vs Vietnamese Unemployment Among Ages 55 to 59 years
COMPARE
Immigrants from Belize
Vietnamese
Unemployment Among Ages 55 to 59 years
Unemployment Among Ages 55 to 59 years Comparison
Immigrants from Belize
Vietnamese
5.5%
UNEMPLOYMENT AMONG AGES 55 TO 59 YEARS
0.0/ 100
METRIC RATING
307th/ 347
METRIC RANK
5.9%
UNEMPLOYMENT AMONG AGES 55 TO 59 YEARS
0.0/ 100
METRIC RATING
324th/ 347
METRIC RANK
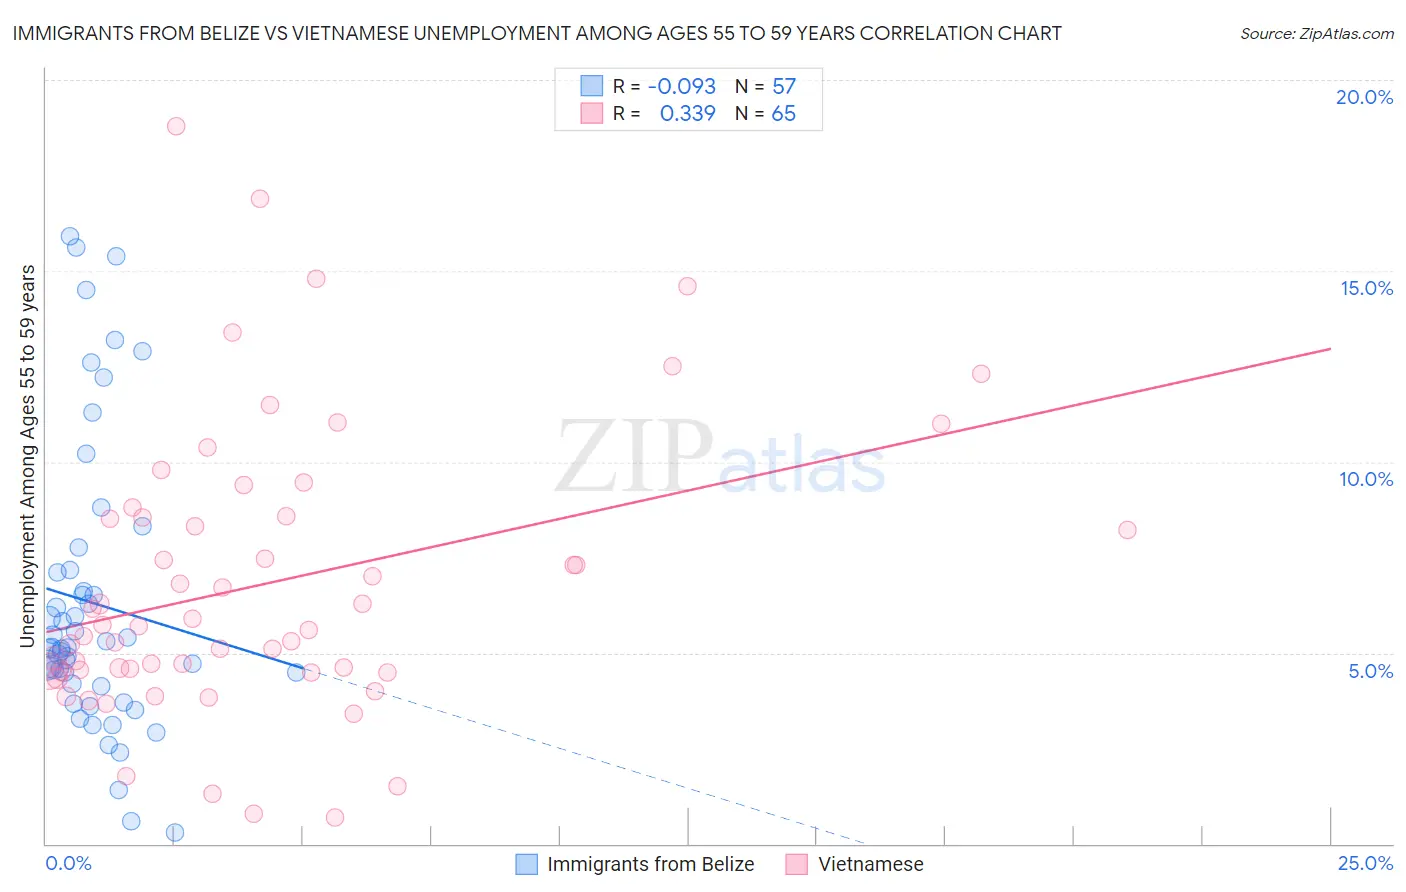
Immigrants from Belize vs Vietnamese Unemployment Among Ages 55 to 59 years Correlation Chart
The statistical analysis conducted on geographies consisting of 127,651,954 people shows a slight negative correlation between the proportion of Immigrants from Belize and unemployment rate among population between the ages 55 and 59 in the United States with a correlation coefficient (R) of -0.093 and weighted average of 5.5%. Similarly, the statistical analysis conducted on geographies consisting of 165,879,881 people shows a mild positive correlation between the proportion of Vietnamese and unemployment rate among population between the ages 55 and 59 in the United States with a correlation coefficient (R) of 0.339 and weighted average of 5.9%, a difference of 6.4%.
Unemployment Among Ages 55 to 59 years Correlation Summary
| Measurement | Immigrants from Belize | Vietnamese |
| Minimum | 0.30% | 0.70% |
| Maximum | 15.9% | 18.8% |
| Range | 15.6% | 18.1% |
| Mean | 6.3% | 6.8% |
| Median | 5.1% | 5.7% |
| Interquartile 25% (IQ1) | 4.2% | 4.5% |
| Interquartile 75% (IQ3) | 7.1% | 8.6% |
| Interquartile Range (IQR) | 3.0% | 4.0% |
| Standard Deviation (Sample) | 3.7% | 3.7% |
| Standard Deviation (Population) | 3.7% | 3.7% |
Demographics Similar to Immigrants from Belize and Vietnamese by Unemployment Among Ages 55 to 59 years
In terms of unemployment among ages 55 to 59 years, the demographic groups most similar to Immigrants from Belize are Immigrants from Cabo Verde (5.5%, a difference of 0.22%), Immigrants from Portugal (5.5%, a difference of 0.34%), Spanish American Indian (5.6%, a difference of 0.50%), Nepalese (5.6%, a difference of 1.1%), and Belizean (5.6%, a difference of 1.5%). Similarly, the demographic groups most similar to Vietnamese are Immigrants from Bangladesh (5.9%, a difference of 0.070%), Crow (5.9%, a difference of 0.080%), Chippewa (5.9%, a difference of 0.14%), Immigrants from Armenia (6.0%, a difference of 1.8%), and Immigrants from the Azores (5.8%, a difference of 2.0%).
| Demographics | Rating | Rank | Unemployment Among Ages 55 to 59 years |
| Immigrants | Portugal | 0.0 /100 | #305 | Tragic 5.5% |
| Immigrants | Cabo Verde | 0.0 /100 | #306 | Tragic 5.5% |
| Immigrants | Belize | 0.0 /100 | #307 | Tragic 5.5% |
| Spanish American Indians | 0.0 /100 | #308 | Tragic 5.6% |
| Nepalese | 0.0 /100 | #309 | Tragic 5.6% |
| Belizeans | 0.0 /100 | #310 | Tragic 5.6% |
| Houma | 0.0 /100 | #311 | Tragic 5.6% |
| Ecuadorians | 0.0 /100 | #312 | Tragic 5.6% |
| Central American Indians | 0.0 /100 | #313 | Tragic 5.6% |
| Tlingit-Haida | 0.0 /100 | #314 | Tragic 5.7% |
| Guyanese | 0.0 /100 | #315 | Tragic 5.7% |
| Immigrants | Ecuador | 0.0 /100 | #316 | Tragic 5.7% |
| Hmong | 0.0 /100 | #317 | Tragic 5.7% |
| Immigrants | Guyana | 0.0 /100 | #318 | Tragic 5.8% |
| Kiowa | 0.0 /100 | #319 | Tragic 5.8% |
| Immigrants | Azores | 0.0 /100 | #320 | Tragic 5.8% |
| Chippewa | 0.0 /100 | #321 | Tragic 5.9% |
| Crow | 0.0 /100 | #322 | Tragic 5.9% |
| Immigrants | Bangladesh | 0.0 /100 | #323 | Tragic 5.9% |
| Vietnamese | 0.0 /100 | #324 | Tragic 5.9% |
| Immigrants | Armenia | 0.0 /100 | #325 | Tragic 6.0% |