Immigrants from Belize vs Immigrants from Latvia Unemployment Among Ages 55 to 59 years
COMPARE
Immigrants from Belize
Immigrants from Latvia
Unemployment Among Ages 55 to 59 years
Unemployment Among Ages 55 to 59 years Comparison
Immigrants from Belize
Immigrants from Latvia
5.5%
UNEMPLOYMENT AMONG AGES 55 TO 59 YEARS
0.0/ 100
METRIC RATING
307th/ 347
METRIC RANK
4.9%
UNEMPLOYMENT AMONG AGES 55 TO 59 YEARS
18.5/ 100
METRIC RATING
204th/ 347
METRIC RANK
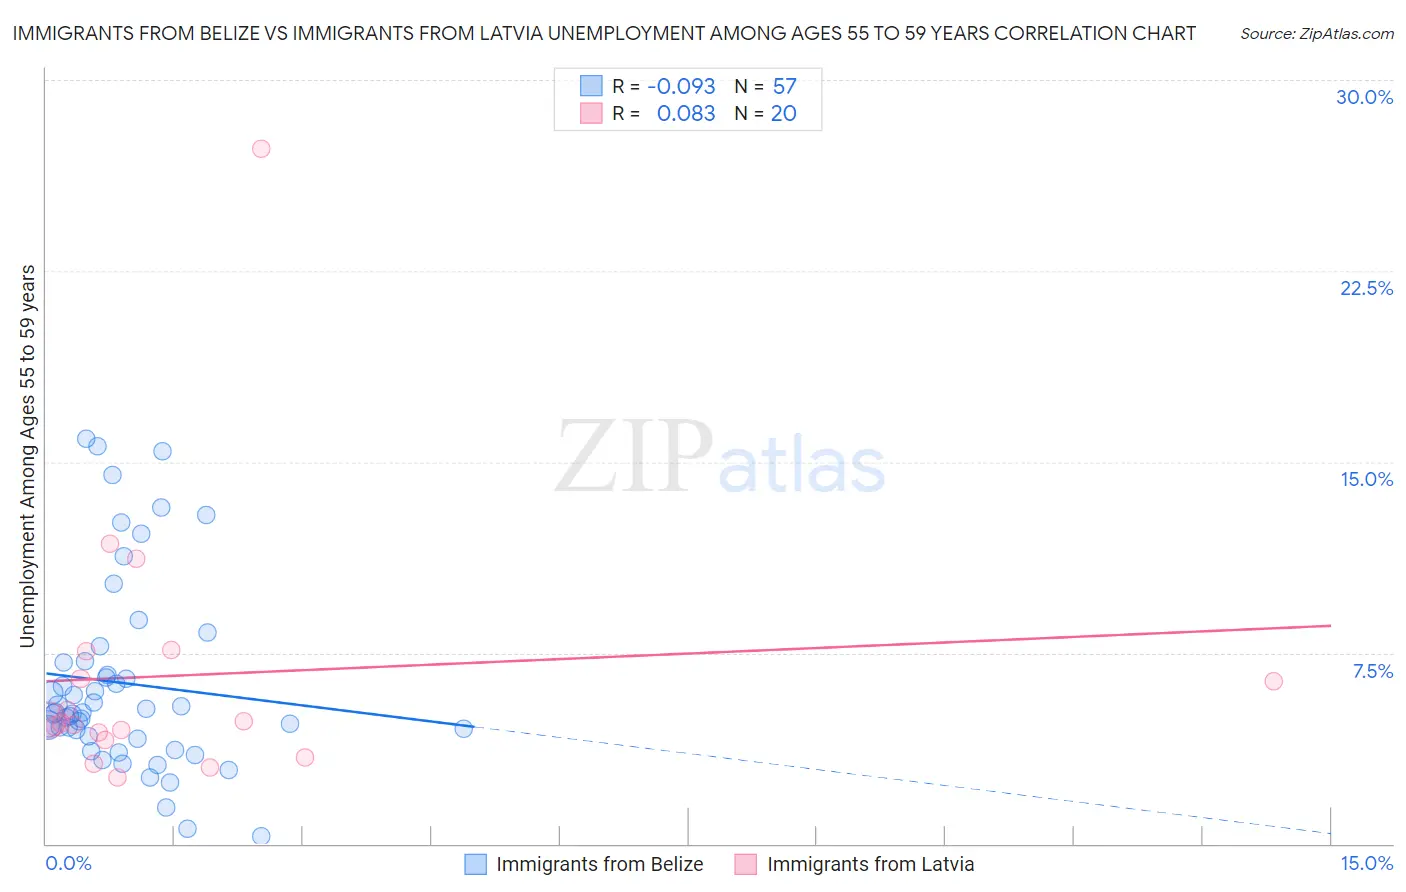
Immigrants from Belize vs Immigrants from Latvia Unemployment Among Ages 55 to 59 years Correlation Chart
The statistical analysis conducted on geographies consisting of 127,651,954 people shows a slight negative correlation between the proportion of Immigrants from Belize and unemployment rate among population between the ages 55 and 59 in the United States with a correlation coefficient (R) of -0.093 and weighted average of 5.5%. Similarly, the statistical analysis conducted on geographies consisting of 111,271,866 people shows a slight positive correlation between the proportion of Immigrants from Latvia and unemployment rate among population between the ages 55 and 59 in the United States with a correlation coefficient (R) of 0.083 and weighted average of 4.9%, a difference of 13.0%.
Unemployment Among Ages 55 to 59 years Correlation Summary
| Measurement | Immigrants from Belize | Immigrants from Latvia |
| Minimum | 0.30% | 2.6% |
| Maximum | 15.9% | 27.3% |
| Range | 15.6% | 24.7% |
| Mean | 6.3% | 6.6% |
| Median | 5.1% | 4.8% |
| Interquartile 25% (IQ1) | 4.2% | 4.2% |
| Interquartile 75% (IQ3) | 7.1% | 7.0% |
| Interquartile Range (IQR) | 3.0% | 2.8% |
| Standard Deviation (Sample) | 3.7% | 5.5% |
| Standard Deviation (Population) | 3.7% | 5.3% |
Similar Demographics by Unemployment Among Ages 55 to 59 years
Demographics Similar to Immigrants from Belize by Unemployment Among Ages 55 to 59 years
In terms of unemployment among ages 55 to 59 years, the demographic groups most similar to Immigrants from Belize are Immigrants from Cabo Verde (5.5%, a difference of 0.22%), Immigrants from Portugal (5.5%, a difference of 0.34%), Spanish American Indian (5.6%, a difference of 0.50%), Black/African American (5.5%, a difference of 0.51%), and Sierra Leonean (5.5%, a difference of 1.0%).
| Demographics | Rating | Rank | Unemployment Among Ages 55 to 59 years |
| Immigrants | St. Vincent and the Grenadines | 0.0 /100 | #300 | Tragic 5.4% |
| Immigrants | Dominica | 0.0 /100 | #301 | Tragic 5.5% |
| Sierra Leoneans | 0.0 /100 | #302 | Tragic 5.5% |
| Marshallese | 0.0 /100 | #303 | Tragic 5.5% |
| Blacks/African Americans | 0.0 /100 | #304 | Tragic 5.5% |
| Immigrants | Portugal | 0.0 /100 | #305 | Tragic 5.5% |
| Immigrants | Cabo Verde | 0.0 /100 | #306 | Tragic 5.5% |
| Immigrants | Belize | 0.0 /100 | #307 | Tragic 5.5% |
| Spanish American Indians | 0.0 /100 | #308 | Tragic 5.6% |
| Nepalese | 0.0 /100 | #309 | Tragic 5.6% |
| Belizeans | 0.0 /100 | #310 | Tragic 5.6% |
| Houma | 0.0 /100 | #311 | Tragic 5.6% |
| Ecuadorians | 0.0 /100 | #312 | Tragic 5.6% |
| Central American Indians | 0.0 /100 | #313 | Tragic 5.6% |
| Tlingit-Haida | 0.0 /100 | #314 | Tragic 5.7% |
Demographics Similar to Immigrants from Latvia by Unemployment Among Ages 55 to 59 years
In terms of unemployment among ages 55 to 59 years, the demographic groups most similar to Immigrants from Latvia are Haitian (4.9%, a difference of 0.020%), Guamanian/Chamorro (4.9%, a difference of 0.15%), Lumbee (4.9%, a difference of 0.25%), Immigrants from South America (4.9%, a difference of 0.28%), and Basque (4.9%, a difference of 0.30%).
| Demographics | Rating | Rank | Unemployment Among Ages 55 to 59 years |
| Macedonians | 26.4 /100 | #197 | Fair 4.9% |
| Immigrants | Philippines | 26.1 /100 | #198 | Fair 4.9% |
| Immigrants | Russia | 23.7 /100 | #199 | Fair 4.9% |
| Basques | 23.3 /100 | #200 | Fair 4.9% |
| Immigrants | South America | 23.1 /100 | #201 | Fair 4.9% |
| Lumbee | 22.5 /100 | #202 | Fair 4.9% |
| Guamanians/Chamorros | 20.8 /100 | #203 | Fair 4.9% |
| Immigrants | Latvia | 18.5 /100 | #204 | Poor 4.9% |
| Haitians | 18.1 /100 | #205 | Poor 4.9% |
| Immigrants | Belarus | 14.1 /100 | #206 | Poor 4.9% |
| Immigrants | Australia | 14.1 /100 | #207 | Poor 4.9% |
| Immigrants | Kazakhstan | 14.0 /100 | #208 | Poor 4.9% |
| Immigrants | Haiti | 13.3 /100 | #209 | Poor 4.9% |
| Creek | 12.9 /100 | #210 | Poor 4.9% |
| Hawaiians | 12.8 /100 | #211 | Poor 4.9% |