Immigrants from Belize vs Immigrants from China Unemployment
COMPARE
Immigrants from Belize
Immigrants from China
Unemployment
Unemployment Comparison
Immigrants from Belize
Immigrants from China
6.5%
UNEMPLOYMENT
0.0/ 100
METRIC RATING
310th/ 347
METRIC RANK
5.2%
UNEMPLOYMENT
74.7/ 100
METRIC RATING
154th/ 347
METRIC RANK
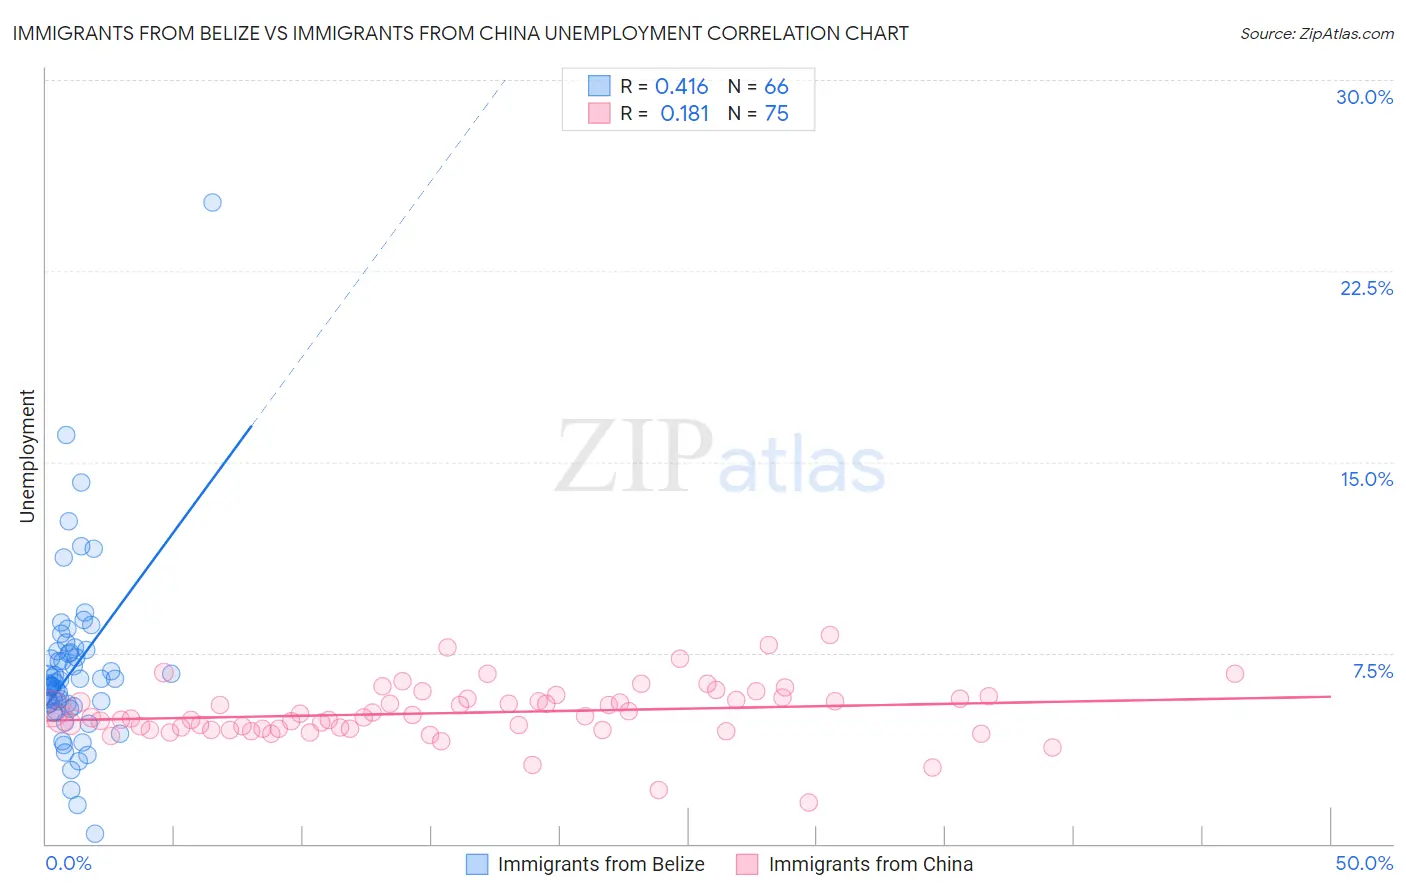
Immigrants from Belize vs Immigrants from China Unemployment Correlation Chart
The statistical analysis conducted on geographies consisting of 130,280,852 people shows a moderate positive correlation between the proportion of Immigrants from Belize and unemployment in the United States with a correlation coefficient (R) of 0.416 and weighted average of 6.5%. Similarly, the statistical analysis conducted on geographies consisting of 456,493,067 people shows a poor positive correlation between the proportion of Immigrants from China and unemployment in the United States with a correlation coefficient (R) of 0.181 and weighted average of 5.2%, a difference of 26.0%.
Unemployment Correlation Summary
| Measurement | Immigrants from Belize | Immigrants from China |
| Minimum | 0.40% | 1.6% |
| Maximum | 25.2% | 8.2% |
| Range | 24.8% | 6.6% |
| Mean | 6.9% | 5.1% |
| Median | 6.4% | 5.0% |
| Interquartile 25% (IQ1) | 5.4% | 4.5% |
| Interquartile 75% (IQ3) | 7.5% | 5.7% |
| Interquartile Range (IQR) | 2.2% | 1.2% |
| Standard Deviation (Sample) | 3.5% | 1.1% |
| Standard Deviation (Population) | 3.5% | 1.1% |
Similar Demographics by Unemployment
Demographics Similar to Immigrants from Belize by Unemployment
In terms of unemployment, the demographic groups most similar to Immigrants from Belize are Vietnamese (6.5%, a difference of 0.27%), Barbadian (6.5%, a difference of 0.28%), Cape Verdean (6.5%, a difference of 0.33%), Immigrants from Bangladesh (6.5%, a difference of 0.65%), and Colville (6.6%, a difference of 0.91%).
| Demographics | Rating | Rank | Unemployment |
| Belizeans | 0.0 /100 | #303 | Tragic 6.4% |
| Immigrants | Jamaica | 0.0 /100 | #304 | Tragic 6.4% |
| Menominee | 0.0 /100 | #305 | Tragic 6.4% |
| Lumbee | 0.0 /100 | #306 | Tragic 6.4% |
| Immigrants | Bangladesh | 0.0 /100 | #307 | Tragic 6.5% |
| Barbadians | 0.0 /100 | #308 | Tragic 6.5% |
| Vietnamese | 0.0 /100 | #309 | Tragic 6.5% |
| Immigrants | Belize | 0.0 /100 | #310 | Tragic 6.5% |
| Cape Verdeans | 0.0 /100 | #311 | Tragic 6.5% |
| Colville | 0.0 /100 | #312 | Tragic 6.6% |
| Immigrants | Barbados | 0.0 /100 | #313 | Tragic 6.6% |
| Blacks/African Americans | 0.0 /100 | #314 | Tragic 6.6% |
| Houma | 0.0 /100 | #315 | Tragic 6.7% |
| Immigrants | Dominica | 0.0 /100 | #316 | Tragic 6.7% |
| Shoshone | 0.0 /100 | #317 | Tragic 6.8% |
Demographics Similar to Immigrants from China by Unemployment
In terms of unemployment, the demographic groups most similar to Immigrants from China are Immigrants from Hong Kong (5.2%, a difference of 0.040%), Egyptian (5.2%, a difference of 0.040%), Immigrants from Eastern Europe (5.2%, a difference of 0.050%), Potawatomi (5.2%, a difference of 0.12%), and Syrian (5.2%, a difference of 0.26%).
| Demographics | Rating | Rank | Unemployment |
| Indians (Asian) | 81.6 /100 | #147 | Excellent 5.1% |
| Immigrants | Italy | 79.1 /100 | #148 | Good 5.1% |
| Syrians | 77.7 /100 | #149 | Good 5.2% |
| Potawatomi | 76.2 /100 | #150 | Good 5.2% |
| Immigrants | Eastern Europe | 75.3 /100 | #151 | Good 5.2% |
| Immigrants | Hong Kong | 75.2 /100 | #152 | Good 5.2% |
| Egyptians | 75.2 /100 | #153 | Good 5.2% |
| Immigrants | China | 74.7 /100 | #154 | Good 5.2% |
| Immigrants | Northern Africa | 71.3 /100 | #155 | Good 5.2% |
| Immigrants | Kazakhstan | 70.4 /100 | #156 | Good 5.2% |
| Sri Lankans | 69.5 /100 | #157 | Good 5.2% |
| Immigrants | Egypt | 66.7 /100 | #158 | Good 5.2% |
| Immigrants | Russia | 66.6 /100 | #159 | Good 5.2% |
| Laotians | 66.3 /100 | #160 | Good 5.2% |
| Immigrants | Oceania | 65.2 /100 | #161 | Good 5.2% |