Armenian vs Immigrants from China Unemployment
COMPARE
Armenian
Immigrants from China
Unemployment
Unemployment Comparison
Armenians
Immigrants from China
6.0%
UNEMPLOYMENT
0.0/ 100
METRIC RATING
277th/ 347
METRIC RANK
5.2%
UNEMPLOYMENT
74.7/ 100
METRIC RATING
154th/ 347
METRIC RANK
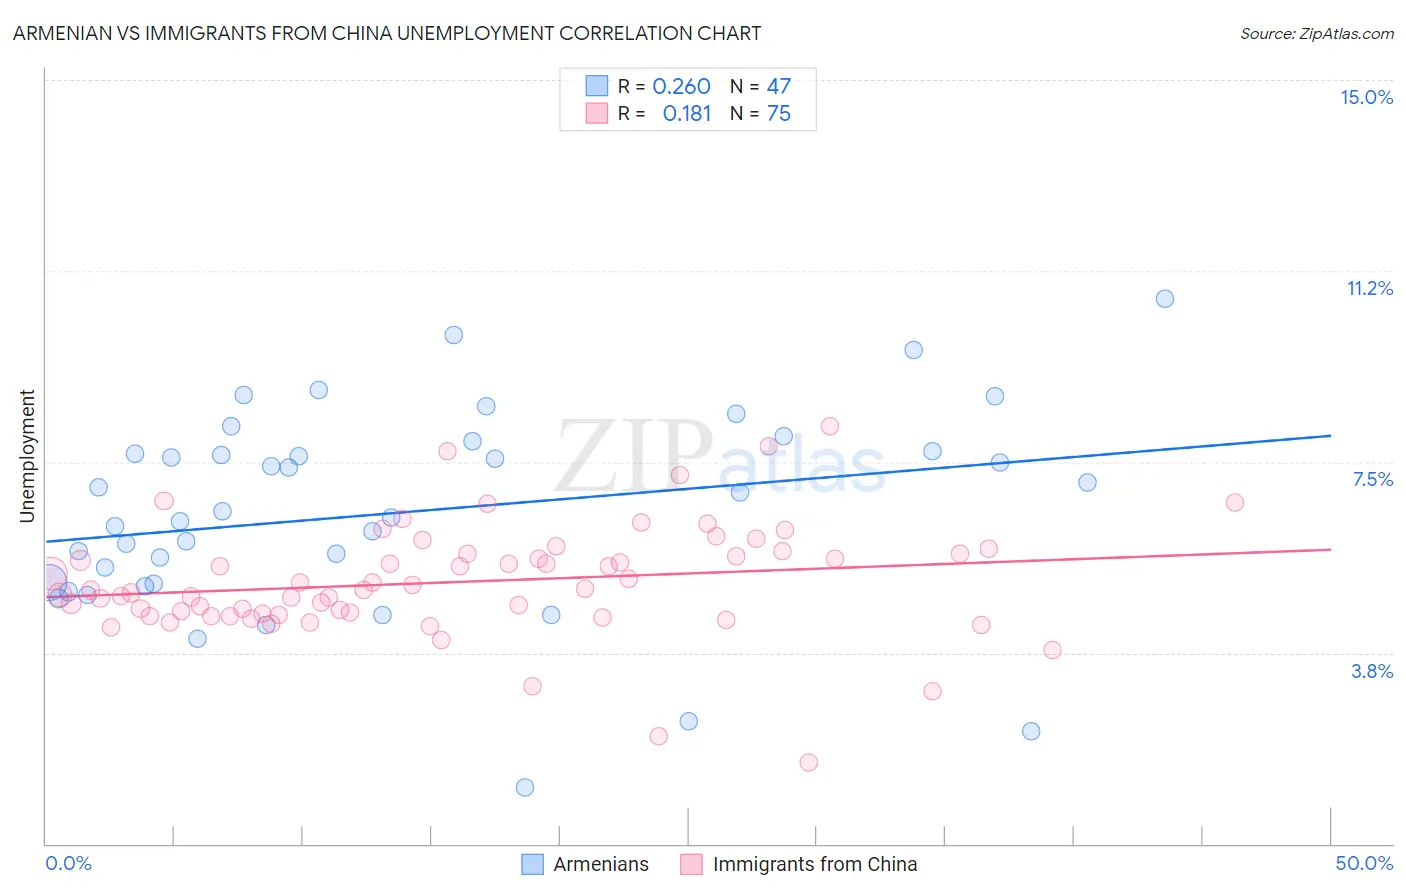
Armenian vs Immigrants from China Unemployment Correlation Chart
The statistical analysis conducted on geographies consisting of 310,750,018 people shows a weak positive correlation between the proportion of Armenians and unemployment in the United States with a correlation coefficient (R) of 0.260 and weighted average of 6.0%. Similarly, the statistical analysis conducted on geographies consisting of 456,493,067 people shows a poor positive correlation between the proportion of Immigrants from China and unemployment in the United States with a correlation coefficient (R) of 0.181 and weighted average of 5.2%, a difference of 15.6%.
Unemployment Correlation Summary
| Measurement | Armenian | Immigrants from China |
| Minimum | 1.1% | 1.6% |
| Maximum | 10.7% | 8.2% |
| Range | 9.6% | 6.6% |
| Mean | 6.5% | 5.1% |
| Median | 6.5% | 5.0% |
| Interquartile 25% (IQ1) | 5.1% | 4.5% |
| Interquartile 75% (IQ3) | 7.7% | 5.7% |
| Interquartile Range (IQR) | 2.6% | 1.2% |
| Standard Deviation (Sample) | 2.0% | 1.1% |
| Standard Deviation (Population) | 2.0% | 1.1% |
Similar Demographics by Unemployment
Demographics Similar to Armenians by Unemployment
In terms of unemployment, the demographic groups most similar to Armenians are Ghanaian (6.0%, a difference of 0.29%), Immigrants from Central America (6.0%, a difference of 0.35%), Immigrants from Latin America (5.9%, a difference of 0.63%), Immigrants from Mexico (6.0%, a difference of 0.72%), and Immigrants from Western Africa (6.0%, a difference of 0.73%).
| Demographics | Rating | Rank | Unemployment |
| Blackfeet | 0.1 /100 | #270 | Tragic 5.8% |
| Mexicans | 0.1 /100 | #271 | Tragic 5.9% |
| Hispanics or Latinos | 0.0 /100 | #272 | Tragic 5.9% |
| Immigrants | Fiji | 0.0 /100 | #273 | Tragic 5.9% |
| Bahamians | 0.0 /100 | #274 | Tragic 5.9% |
| Immigrants | Latin America | 0.0 /100 | #275 | Tragic 5.9% |
| Immigrants | Central America | 0.0 /100 | #276 | Tragic 6.0% |
| Armenians | 0.0 /100 | #277 | Tragic 6.0% |
| Ghanaians | 0.0 /100 | #278 | Tragic 6.0% |
| Immigrants | Mexico | 0.0 /100 | #279 | Tragic 6.0% |
| Immigrants | Western Africa | 0.0 /100 | #280 | Tragic 6.0% |
| Africans | 0.0 /100 | #281 | Tragic 6.1% |
| Immigrants | Azores | 0.0 /100 | #282 | Tragic 6.1% |
| Immigrants | Ghana | 0.0 /100 | #283 | Tragic 6.1% |
| Aleuts | 0.0 /100 | #284 | Tragic 6.1% |
Demographics Similar to Immigrants from China by Unemployment
In terms of unemployment, the demographic groups most similar to Immigrants from China are Immigrants from Hong Kong (5.2%, a difference of 0.040%), Egyptian (5.2%, a difference of 0.040%), Immigrants from Eastern Europe (5.2%, a difference of 0.050%), Potawatomi (5.2%, a difference of 0.12%), and Syrian (5.2%, a difference of 0.26%).
| Demographics | Rating | Rank | Unemployment |
| Indians (Asian) | 81.6 /100 | #147 | Excellent 5.1% |
| Immigrants | Italy | 79.1 /100 | #148 | Good 5.1% |
| Syrians | 77.7 /100 | #149 | Good 5.2% |
| Potawatomi | 76.2 /100 | #150 | Good 5.2% |
| Immigrants | Eastern Europe | 75.3 /100 | #151 | Good 5.2% |
| Immigrants | Hong Kong | 75.2 /100 | #152 | Good 5.2% |
| Egyptians | 75.2 /100 | #153 | Good 5.2% |
| Immigrants | China | 74.7 /100 | #154 | Good 5.2% |
| Immigrants | Northern Africa | 71.3 /100 | #155 | Good 5.2% |
| Immigrants | Kazakhstan | 70.4 /100 | #156 | Good 5.2% |
| Sri Lankans | 69.5 /100 | #157 | Good 5.2% |
| Immigrants | Egypt | 66.7 /100 | #158 | Good 5.2% |
| Immigrants | Russia | 66.6 /100 | #159 | Good 5.2% |
| Laotians | 66.3 /100 | #160 | Good 5.2% |
| Immigrants | Oceania | 65.2 /100 | #161 | Good 5.2% |