Asian vs Immigrants from China Unemployment
COMPARE
Asian
Immigrants from China
Unemployment
Unemployment Comparison
Asians
Immigrants from China
5.1%
UNEMPLOYMENT
89.0/ 100
METRIC RATING
123rd/ 347
METRIC RANK
5.2%
UNEMPLOYMENT
74.7/ 100
METRIC RATING
154th/ 347
METRIC RANK
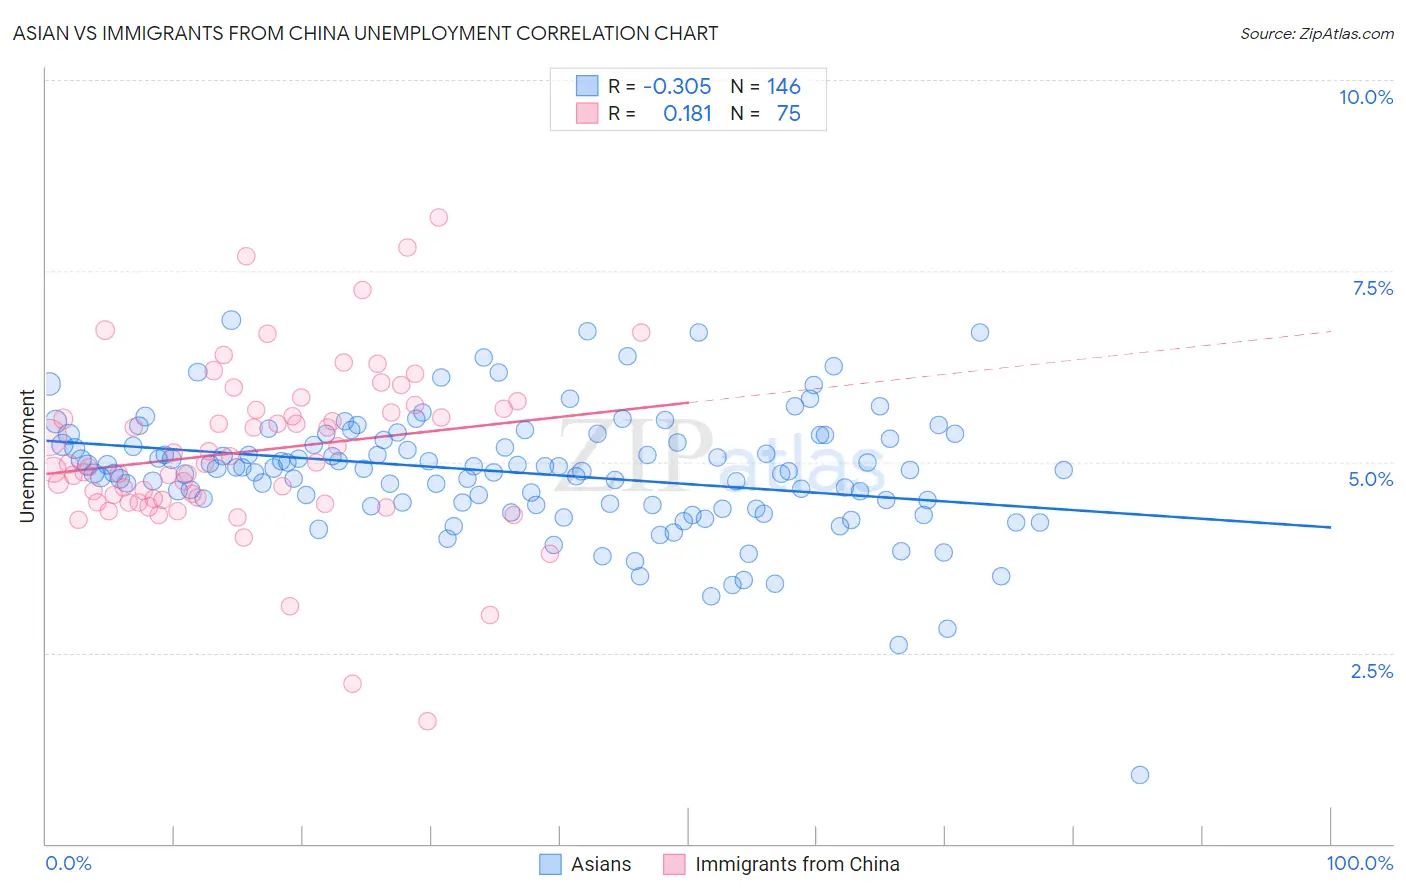
Asian vs Immigrants from China Unemployment Correlation Chart
The statistical analysis conducted on geographies consisting of 548,726,381 people shows a mild negative correlation between the proportion of Asians and unemployment in the United States with a correlation coefficient (R) of -0.305 and weighted average of 5.1%. Similarly, the statistical analysis conducted on geographies consisting of 456,493,067 people shows a poor positive correlation between the proportion of Immigrants from China and unemployment in the United States with a correlation coefficient (R) of 0.181 and weighted average of 5.2%, a difference of 1.6%.
Unemployment Correlation Summary
| Measurement | Asian | Immigrants from China |
| Minimum | 0.90% | 1.6% |
| Maximum | 6.9% | 8.2% |
| Range | 6.0% | 6.6% |
| Mean | 4.9% | 5.1% |
| Median | 4.9% | 5.0% |
| Interquartile 25% (IQ1) | 4.5% | 4.5% |
| Interquartile 75% (IQ3) | 5.3% | 5.7% |
| Interquartile Range (IQR) | 0.84% | 1.2% |
| Standard Deviation (Sample) | 0.81% | 1.1% |
| Standard Deviation (Population) | 0.81% | 1.1% |
Similar Demographics by Unemployment
Demographics Similar to Asians by Unemployment
In terms of unemployment, the demographic groups most similar to Asians are Immigrants from Switzerland (5.1%, a difference of 0.020%), Lebanese (5.1%, a difference of 0.040%), Ethiopian (5.1%, a difference of 0.050%), Immigrants from Eastern Asia (5.1%, a difference of 0.10%), and Macedonian (5.1%, a difference of 0.11%).
| Demographics | Rating | Rank | Unemployment |
| Immigrants | Sri Lanka | 91.1 /100 | #116 | Exceptional 5.1% |
| Immigrants | Malaysia | 91.0 /100 | #117 | Exceptional 5.1% |
| Immigrants | Germany | 90.8 /100 | #118 | Exceptional 5.1% |
| Immigrants | France | 89.7 /100 | #119 | Excellent 5.1% |
| Macedonians | 89.7 /100 | #120 | Excellent 5.1% |
| Lebanese | 89.2 /100 | #121 | Excellent 5.1% |
| Immigrants | Switzerland | 89.1 /100 | #122 | Excellent 5.1% |
| Asians | 89.0 /100 | #123 | Excellent 5.1% |
| Ethiopians | 88.6 /100 | #124 | Excellent 5.1% |
| Immigrants | Eastern Asia | 88.3 /100 | #125 | Excellent 5.1% |
| Kenyans | 88.2 /100 | #126 | Excellent 5.1% |
| Immigrants | Kenya | 88.2 /100 | #127 | Excellent 5.1% |
| Immigrants | Eastern Africa | 88.1 /100 | #128 | Excellent 5.1% |
| Immigrants | Latvia | 88.0 /100 | #129 | Excellent 5.1% |
| Iranians | 86.9 /100 | #130 | Excellent 5.1% |
Demographics Similar to Immigrants from China by Unemployment
In terms of unemployment, the demographic groups most similar to Immigrants from China are Immigrants from Hong Kong (5.2%, a difference of 0.040%), Egyptian (5.2%, a difference of 0.040%), Immigrants from Eastern Europe (5.2%, a difference of 0.050%), Potawatomi (5.2%, a difference of 0.12%), and Syrian (5.2%, a difference of 0.26%).
| Demographics | Rating | Rank | Unemployment |
| Indians (Asian) | 81.6 /100 | #147 | Excellent 5.1% |
| Immigrants | Italy | 79.1 /100 | #148 | Good 5.1% |
| Syrians | 77.7 /100 | #149 | Good 5.2% |
| Potawatomi | 76.2 /100 | #150 | Good 5.2% |
| Immigrants | Eastern Europe | 75.3 /100 | #151 | Good 5.2% |
| Immigrants | Hong Kong | 75.2 /100 | #152 | Good 5.2% |
| Egyptians | 75.2 /100 | #153 | Good 5.2% |
| Immigrants | China | 74.7 /100 | #154 | Good 5.2% |
| Immigrants | Northern Africa | 71.3 /100 | #155 | Good 5.2% |
| Immigrants | Kazakhstan | 70.4 /100 | #156 | Good 5.2% |
| Sri Lankans | 69.5 /100 | #157 | Good 5.2% |
| Immigrants | Egypt | 66.7 /100 | #158 | Good 5.2% |
| Immigrants | Russia | 66.6 /100 | #159 | Good 5.2% |
| Laotians | 66.3 /100 | #160 | Good 5.2% |
| Immigrants | Oceania | 65.2 /100 | #161 | Good 5.2% |