Immigrants from Belize vs Immigrants from Bosnia and Herzegovina Unemployment
COMPARE
Immigrants from Belize
Immigrants from Bosnia and Herzegovina
Unemployment
Unemployment Comparison
Immigrants from Belize
Immigrants from Bosnia and Herzegovina
6.5%
UNEMPLOYMENT
0.0/ 100
METRIC RATING
310th/ 347
METRIC RANK
4.8%
UNEMPLOYMENT
99.7/ 100
METRIC RATING
41st/ 347
METRIC RANK
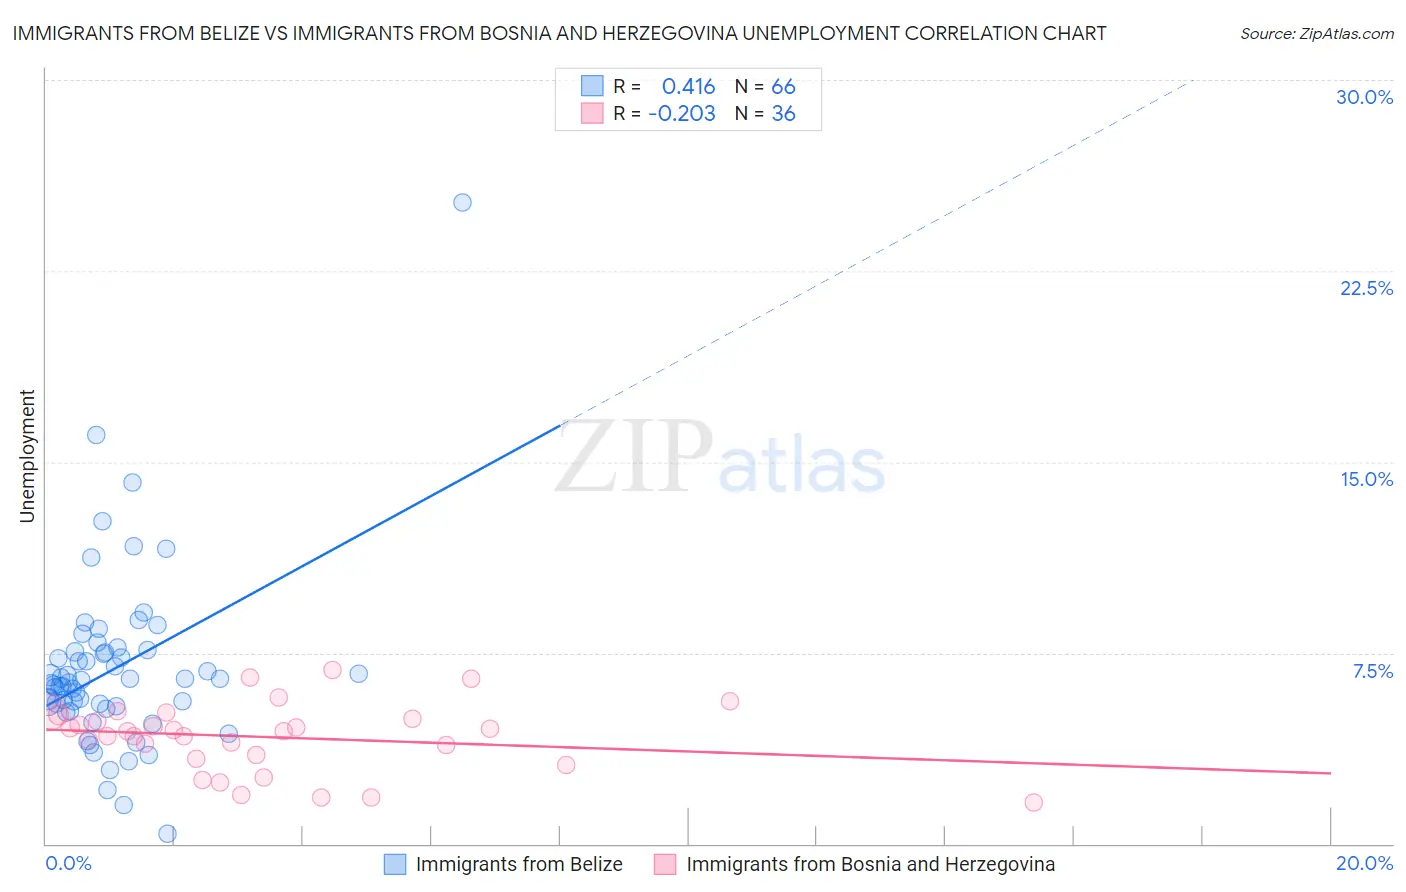
Immigrants from Belize vs Immigrants from Bosnia and Herzegovina Unemployment Correlation Chart
The statistical analysis conducted on geographies consisting of 130,280,852 people shows a moderate positive correlation between the proportion of Immigrants from Belize and unemployment in the United States with a correlation coefficient (R) of 0.416 and weighted average of 6.5%. Similarly, the statistical analysis conducted on geographies consisting of 156,781,298 people shows a weak negative correlation between the proportion of Immigrants from Bosnia and Herzegovina and unemployment in the United States with a correlation coefficient (R) of -0.203 and weighted average of 4.8%, a difference of 35.7%.
Unemployment Correlation Summary
| Measurement | Immigrants from Belize | Immigrants from Bosnia and Herzegovina |
| Minimum | 0.40% | 1.6% |
| Maximum | 25.2% | 6.8% |
| Range | 24.8% | 5.2% |
| Mean | 6.9% | 4.2% |
| Median | 6.4% | 4.4% |
| Interquartile 25% (IQ1) | 5.4% | 3.4% |
| Interquartile 75% (IQ3) | 7.5% | 5.0% |
| Interquartile Range (IQR) | 2.2% | 1.6% |
| Standard Deviation (Sample) | 3.5% | 1.3% |
| Standard Deviation (Population) | 3.5% | 1.3% |
Similar Demographics by Unemployment
Demographics Similar to Immigrants from Belize by Unemployment
In terms of unemployment, the demographic groups most similar to Immigrants from Belize are Vietnamese (6.5%, a difference of 0.27%), Barbadian (6.5%, a difference of 0.28%), Cape Verdean (6.5%, a difference of 0.33%), Immigrants from Bangladesh (6.5%, a difference of 0.65%), and Colville (6.6%, a difference of 0.91%).
| Demographics | Rating | Rank | Unemployment |
| Belizeans | 0.0 /100 | #303 | Tragic 6.4% |
| Immigrants | Jamaica | 0.0 /100 | #304 | Tragic 6.4% |
| Menominee | 0.0 /100 | #305 | Tragic 6.4% |
| Lumbee | 0.0 /100 | #306 | Tragic 6.4% |
| Immigrants | Bangladesh | 0.0 /100 | #307 | Tragic 6.5% |
| Barbadians | 0.0 /100 | #308 | Tragic 6.5% |
| Vietnamese | 0.0 /100 | #309 | Tragic 6.5% |
| Immigrants | Belize | 0.0 /100 | #310 | Tragic 6.5% |
| Cape Verdeans | 0.0 /100 | #311 | Tragic 6.5% |
| Colville | 0.0 /100 | #312 | Tragic 6.6% |
| Immigrants | Barbados | 0.0 /100 | #313 | Tragic 6.6% |
| Blacks/African Americans | 0.0 /100 | #314 | Tragic 6.6% |
| Houma | 0.0 /100 | #315 | Tragic 6.7% |
| Immigrants | Dominica | 0.0 /100 | #316 | Tragic 6.7% |
| Shoshone | 0.0 /100 | #317 | Tragic 6.8% |
Demographics Similar to Immigrants from Bosnia and Herzegovina by Unemployment
In terms of unemployment, the demographic groups most similar to Immigrants from Bosnia and Herzegovina are Northern European (4.8%, a difference of 0.030%), Lithuanian (4.8%, a difference of 0.040%), Bolivian (4.8%, a difference of 0.19%), Czechoslovakian (4.8%, a difference of 0.38%), and Tongan (4.8%, a difference of 0.45%).
| Demographics | Rating | Rank | Unemployment |
| Immigrants | Bolivia | 99.8 /100 | #34 | Exceptional 4.8% |
| Scotch-Irish | 99.8 /100 | #35 | Exceptional 4.8% |
| Tongans | 99.7 /100 | #36 | Exceptional 4.8% |
| Czechoslovakians | 99.7 /100 | #37 | Exceptional 4.8% |
| Bolivians | 99.7 /100 | #38 | Exceptional 4.8% |
| Lithuanians | 99.7 /100 | #39 | Exceptional 4.8% |
| Northern Europeans | 99.7 /100 | #40 | Exceptional 4.8% |
| Immigrants | Bosnia and Herzegovina | 99.7 /100 | #41 | Exceptional 4.8% |
| Filipinos | 99.5 /100 | #42 | Exceptional 4.8% |
| Yugoslavians | 99.5 /100 | #43 | Exceptional 4.8% |
| Austrians | 99.5 /100 | #44 | Exceptional 4.8% |
| French | 99.5 /100 | #45 | Exceptional 4.8% |
| Immigrants | Nepal | 99.4 /100 | #46 | Exceptional 4.8% |
| Immigrants | Taiwan | 99.4 /100 | #47 | Exceptional 4.8% |
| Immigrants | Scotland | 99.3 /100 | #48 | Exceptional 4.9% |