Seminole vs Immigrants from Bosnia and Herzegovina Unemployment Among Ages 55 to 59 years

COMPARE

Seminole
Race
Ancestry
AfghanAfricanAlaska NativeAlaskan AthabascanAlbanianAleutAlsatianAmericanApacheArabArapahoArgentineanArmenianAssyrian/Chaldean/SyriacAustralianAustrianBahamianBangladeshiBarbadianBasqueBelgianBelizeanBermudanBhutaneseBlackfeetBolivianBrazilianBritishBritish West IndianBulgarianBurmeseCajunCambodianCanadianCape VerdeanCarpatho RusynCelticCentral AmericanCentral American IndianCherokeeCheyenneChickasawChileanChineseChippewaChoctawColombianColvilleComancheCosta RicanCreeCreekCroatianCrowCubanCypriotCzechCzechoslovakianDanishDelawareDominicanDutchDutch West IndianEastern EuropeanEcuadorianEgyptianEnglishEstonianEthiopianEuropeanFijianFilipinoFinnishFrenchFrench American IndianFrench CanadianGermanGerman RussianGhanaianGreekGuamanian/ChamorroGuatemalanGuyaneseHaitianHmongHonduranHopiHoumaHungarianIcelanderIndian (Asian)IndonesianInupiatIranianIraqiIrishIroquoisIsraeliItalianJamaicanJapaneseJordanianKenyanKiowaKoreanLaotianLatvianLebaneseLiberianLithuanianLumbeeLuxembourgerMacedonianMalaysianMalteseMarshalleseMenomineeMexicanMexican American IndianMongolianMoroccanNative HawaiianNavajoNepaleseNew ZealanderNicaraguanNigerianNorthern EuropeanNorwegianOkinawanOsageOttawaPaiutePakistaniPalestinianPanamanianParaguayanPennsylvania GermanPeruvianPimaPolishPortuguesePotawatomiPuebloPuerto RicanPuget Sound SalishRomanianRussianSalvadoranSamoanScandinavianScotch-IrishScottishSeminoleSenegaleseSerbianShoshoneSierra LeoneanSiouxSlavicSlovakSloveneSomaliSouth AfricanSouth AmericanSouth American IndianSoviet UnionSpaniardSpanishSpanish AmericanSpanish American IndianSri LankanSubsaharan AfricanSudaneseSwedishSwissSyrianTaiwaneseThaiTlingit-HaidaTohono O'OdhamTonganTrinidadian and TobagonianTsimshianTurkishU.S. Virgin IslanderUgandanUkrainianUruguayanUteVenezuelanVietnameseWelshWest IndianYakamaYaquiYugoslavianYumanYup'ikZimbabwean
Immigration
NonimmigrantsImmigrantsAfghanistanAfricaAlbaniaArgentinaArmeniaAsiaAustraliaAustriaBahamasBangladeshBarbadosBelarusBelgiumBelizeBoliviaBrazilBulgariaBurma/MyanmarCabo VerdeCambodiaCameroonCanadaCaribbeanCentral AmericaChileChinaColombiaCongoCosta RicaCroatiaCubaCzechoslovakiaDenmarkDominicaDominican RepublicEastern AfricaEastern AsiaEastern EuropeEcuadorEgyptEl SalvadorEnglandEritreaEthiopiaEuropeFijiFranceGermanyGhanaGreeceGrenadaGuatemalaGuyanaHaitiHondurasHong KongHungaryIndiaIndonesiaIranIraqIrelandIsraelItalyJamaicaJapanJordanKazakhstanKenyaKoreaKuwaitLaosLatin AmericaLatviaLebanonLiberiaLithuaniaMalaysiaMexicoMicronesiaMiddle AfricaMoldovaMoroccoNepalNetherlandsNicaraguaNigeriaNorth AmericaNorth MacedoniaNorthern AfricaNorthern EuropeNorwayOceaniaPakistanPanamaPeruPhilippinesPolandPortugalRomaniaRussiaSaudi ArabiaScotlandSenegalSerbiaSierra LeoneSingaporeSomaliaSouth AfricaSouth AmericaSouth Central AsiaSouth Eastern AsiaSouthern EuropeSpainSri LankaSt. Vincent and the GrenadinesSudanSwedenSwitzerlandSyriaTaiwanThailandTrinidad and TobagoTurkeyUgandaUkraineUruguayUzbekistanVenezuelaVietnamWest IndiesWestern AfricaWestern AsiaWestern EuropeYemenZaireZimbabweAzores
Immigrants from Bosnia and Herzegovina
Race
Ancestry
AfghanAfricanAlaska NativeAlaskan AthabascanAlbanianAleutAlsatianAmericanApacheArabArapahoArgentineanArmenianAssyrian/Chaldean/SyriacAustralianAustrianBahamianBangladeshiBarbadianBasqueBelgianBelizeanBermudanBhutaneseBlackfeetBolivianBrazilianBritishBritish West IndianBulgarianBurmeseCajunCambodianCanadianCape VerdeanCarpatho RusynCelticCentral AmericanCentral American IndianCherokeeCheyenneChickasawChileanChineseChippewaChoctawColombianColvilleComancheCosta RicanCreeCreekCroatianCrowCubanCypriotCzechCzechoslovakianDanishDelawareDominicanDutchDutch West IndianEastern EuropeanEcuadorianEgyptianEnglishEstonianEthiopianEuropeanFijianFilipinoFinnishFrenchFrench American IndianFrench CanadianGermanGerman RussianGhanaianGreekGuamanian/ChamorroGuatemalanGuyaneseHaitianHmongHonduranHopiHoumaHungarianIcelanderIndian (Asian)IndonesianInupiatIranianIraqiIrishIroquoisIsraeliItalianJamaicanJapaneseJordanianKenyanKiowaKoreanLaotianLatvianLebaneseLiberianLithuanianLumbeeLuxembourgerMacedonianMalaysianMalteseMarshalleseMenomineeMexicanMexican American IndianMongolianMoroccanNative HawaiianNavajoNepaleseNew ZealanderNicaraguanNigerianNorthern EuropeanNorwegianOkinawanOsageOttawaPaiutePakistaniPalestinianPanamanianParaguayanPennsylvania GermanPeruvianPimaPolishPortuguesePotawatomiPuebloPuerto RicanPuget Sound SalishRomanianRussianSalvadoranSamoanScandinavianScotch-IrishScottishSenegaleseSerbianShoshoneSierra LeoneanSiouxSlavicSlovakSloveneSomaliSouth AfricanSouth AmericanSouth American IndianSoviet UnionSpaniardSpanishSpanish AmericanSpanish American IndianSri LankanSubsaharan AfricanSudaneseSwedishSwissSyrianTaiwaneseThaiTlingit-HaidaTohono O'OdhamTonganTrinidadian and TobagonianTsimshianTurkishU.S. Virgin IslanderUgandanUkrainianUruguayanUteVenezuelanVietnameseWelshWest IndianYakamaYaquiYugoslavianYumanYup'ikZimbabwean
Immigration
NonimmigrantsImmigrantsAfghanistanAfricaAlbaniaArgentinaArmeniaAsiaAustraliaAustriaBahamasBangladeshBarbadosBelarusBelgiumBelizeBoliviaBosnia and HerzegovinaBrazilBulgariaBurma/MyanmarCabo VerdeCambodiaCameroonCanadaCaribbeanCentral AmericaChileChinaColombiaCongoCosta RicaCroatiaCubaCzechoslovakiaDenmarkDominicaDominican RepublicEastern AfricaEastern AsiaEastern EuropeEcuadorEgyptEl SalvadorEnglandEritreaEthiopiaEuropeFijiFranceGermanyGhanaGreeceGrenadaGuatemalaGuyanaHaitiHondurasHong KongHungaryIndiaIndonesiaIranIraqIrelandIsraelItalyJamaicaJapanJordanKazakhstanKenyaKoreaKuwaitLaosLatin AmericaLatviaLebanonLiberiaLithuaniaMalaysiaMexicoMicronesiaMiddle AfricaMoldovaMoroccoNepalNetherlandsNicaraguaNigeriaNorth AmericaNorth MacedoniaNorthern AfricaNorthern EuropeNorwayOceaniaPakistanPanamaPeruPhilippinesPolandPortugalRomaniaRussiaSaudi ArabiaScotlandSenegalSerbiaSierra LeoneSingaporeSomaliaSouth AfricaSouth AmericaSouth Central AsiaSouth Eastern AsiaSouthern EuropeSpainSri LankaSt. Vincent and the GrenadinesSudanSwedenSwitzerlandSyriaTaiwanThailandTrinidad and TobagoTurkeyUgandaUkraineUruguayUzbekistanVenezuelaVietnamWest IndiesWestern AfricaWestern AsiaWestern EuropeYemenZaireZimbabweAzores
Unemployment Among Ages 55 to 59 years
Income
Poverty
Unemployment
Labor Participation
Family Structure
Vehicle Availability
Education Level
Disability

Unemployment Among Ages 55 to 59 years Comparison

Seminole

Immigrants from Bosnia and Herzegovina

Tragic
Exceptional
5.1%
UNEMPLOYMENT AMONG AGES 55 TO 59 YEARS
0.3/ 100
METRIC RATING
254th/ 347
METRIC RANK
4.6%
UNEMPLOYMENT AMONG AGES 55 TO 59 YEARS
98.3/ 100
METRIC RATING
76th/ 347
METRIC RANK

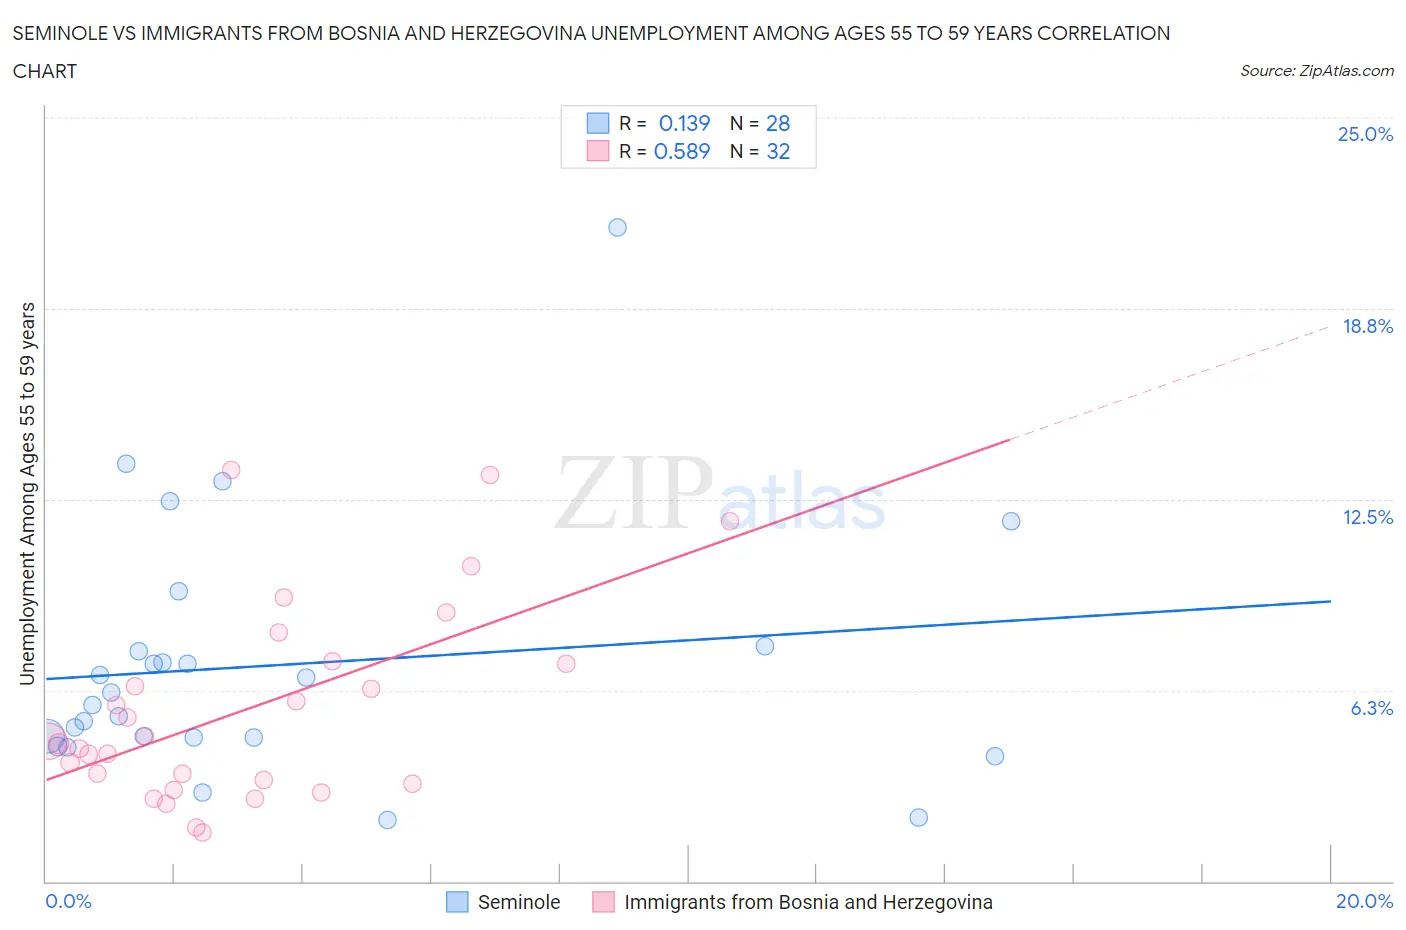
Seminole vs Immigrants from Bosnia and Herzegovina Unemployment Among Ages 55 to 59 years Correlation Chart

The statistical analysis conducted on geographies consisting of 114,500,667 people shows a poor positive correlation between the proportion of Seminole and unemployment rate among population between the ages 55 and 59 in the United States with a correlation coefficient (R) of 0.139 and weighted average of 5.1%. Similarly, the statistical analysis conducted on geographies consisting of 151,718,135 people shows a substantial positive correlation between the proportion of Immigrants from Bosnia and Herzegovina and unemployment rate among population between the ages 55 and 59 in the United States with a correlation coefficient (R) of 0.589 and weighted average of 4.6%, a difference of 10.5%.
Seminole vs Immigrants from Bosnia and Herzegovina Unemployment Among Ages 55 to 59 years

Unemployment Among Ages 55 to 59 years Correlation Summary

MeasurementSeminoleImmigrants from Bosnia and Herzegovina
Minimum2.0%1.6%
Maximum21.4%13.4%
Range19.4%11.9%
Mean7.1%5.6%
Median6.0%4.5%
Interquartile 25% (IQ1)4.7%3.3%
Interquartile 75% (IQ3)7.6%7.2%
Interquartile Range (IQR)2.9%3.9%
Standard Deviation (Sample)4.2%3.2%
Standard Deviation (Population)4.1%3.2%

Similar Demographics by Unemployment Among Ages 55 to 59 years

Demographics Similar to Seminole by Unemployment Among Ages 55 to 59 years

In terms of unemployment among ages 55 to 59 years, the demographic groups most similar to Seminole are Paraguayan (5.1%, a difference of 0.030%), U.S. Virgin Islander (5.1%, a difference of 0.070%), Blackfeet (5.1%, a difference of 0.070%), Portuguese (5.1%, a difference of 0.090%), and Cheyenne (5.1%, a difference of 0.16%).
DemographicsRating | RankUnemployment Among Ages 55 to 59 years
Immigrants | Honduras
0.5
/100
|
#247
Tragic
5.1%
Native Hawaiians
0.5
/100
|
#248
Tragic
5.1%
Comanche
0.4
/100
|
#249
Tragic
5.1%
Cheyenne
0.4
/100
|
#250
Tragic
5.1%
Portuguese
0.3
/100
|
#251
Tragic
5.1%
U.S. Virgin Islanders
0.3
/100
|
#252
Tragic
5.1%
Paraguayans
0.3
/100
|
#253
Tragic
5.1%
Seminole
0.3
/100
|
#254
Tragic
5.1%
Blackfeet
0.3
/100
|
#255
Tragic
5.1%
Senegalese
0.3
/100
|
#256
Tragic
5.1%
Central Americans
0.2
/100
|
#257
Tragic
5.1%
Salvadorans
0.2
/100
|
#258
Tragic
5.1%
Immigrants | West Indies
0.2
/100
|
#259
Tragic
5.1%
Immigrants | Western Africa
0.2
/100
|
#260
Tragic
5.1%
Africans
0.1
/100
|
#261
Tragic
5.1%

Demographics Similar to Immigrants from Bosnia and Herzegovina by Unemployment Among Ages 55 to 59 years

In terms of unemployment among ages 55 to 59 years, the demographic groups most similar to Immigrants from Bosnia and Herzegovina are Scotch-Irish (4.6%, a difference of 0.010%), Finnish (4.6%, a difference of 0.060%), Immigrants from Iraq (4.6%, a difference of 0.070%), Croatian (4.6%, a difference of 0.090%), and Sri Lankan (4.6%, a difference of 0.15%).
DemographicsRating | RankUnemployment Among Ages 55 to 59 years
Czechoslovakians
99.0
/100
|
#69
Exceptional
4.6%
Filipinos
98.8
/100
|
#70
Exceptional
4.6%
Immigrants | Jordan
98.7
/100
|
#71
Exceptional
4.6%
Immigrants | Taiwan
98.7
/100
|
#72
Exceptional
4.6%
Bhutanese
98.6
/100
|
#73
Exceptional
4.6%
Croatians
98.5
/100
|
#74
Exceptional
4.6%
Immigrants | Iraq
98.5
/100
|
#75
Exceptional
4.6%
Immigrants | Bosnia and Herzegovina
98.3
/100
|
#76
Exceptional
4.6%
Scotch-Irish
98.3
/100
|
#77
Exceptional
4.6%
Finns
98.2
/100
|
#78
Exceptional
4.6%
Sri Lankans
98.1
/100
|
#79
Exceptional
4.6%
Cambodians
98.0
/100
|
#80
Exceptional
4.6%
Taiwanese
97.9
/100
|
#81
Exceptional
4.6%
Latvians
97.8
/100
|
#82
Exceptional
4.6%
Lebanese
97.5
/100
|
#83
Exceptional
4.6%