Immigrants from Belize vs Immigrants from Bosnia and Herzegovina Unemployment Among Ages 20 to 24 years
COMPARE
Immigrants from Belize
Immigrants from Bosnia and Herzegovina
Unemployment Among Ages 20 to 24 years
Unemployment Among Ages 20 to 24 years Comparison
Immigrants from Belize
Immigrants from Bosnia and Herzegovina
12.0%
UNEMPLOYMENT AMONG AGES 20 TO 24 YEARS
0.0/ 100
METRIC RATING
294th/ 347
METRIC RANK
9.4%
UNEMPLOYMENT AMONG AGES 20 TO 24 YEARS
100.0/ 100
METRIC RATING
21st/ 347
METRIC RANK
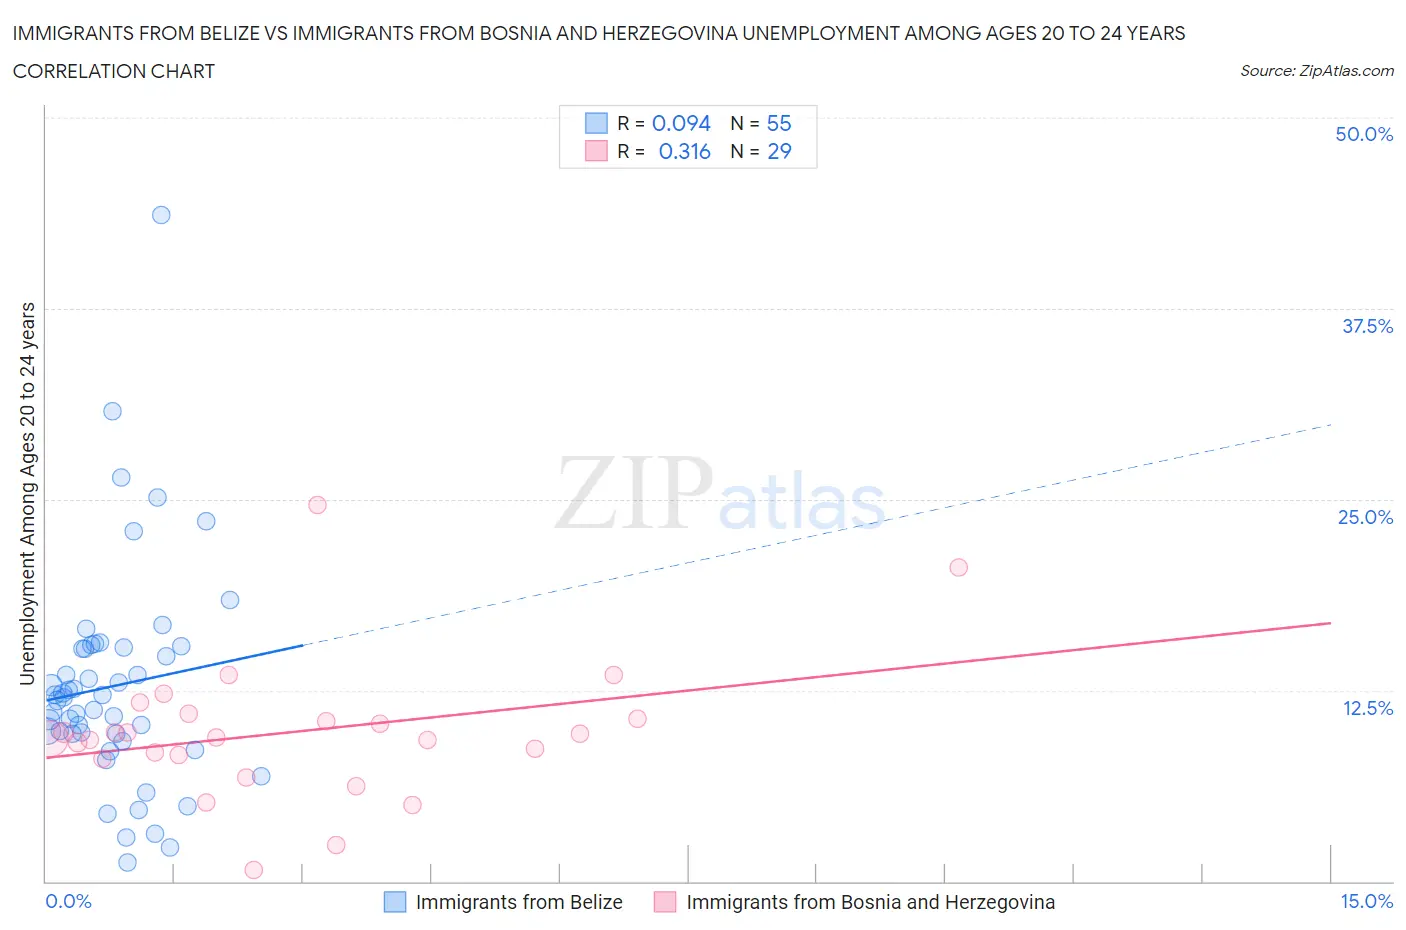
Immigrants from Belize vs Immigrants from Bosnia and Herzegovina Unemployment Among Ages 20 to 24 years Correlation Chart
The statistical analysis conducted on geographies consisting of 129,412,636 people shows a slight positive correlation between the proportion of Immigrants from Belize and unemployment rate among population between the ages 20 and 24 in the United States with a correlation coefficient (R) of 0.094 and weighted average of 12.0%. Similarly, the statistical analysis conducted on geographies consisting of 154,747,093 people shows a mild positive correlation between the proportion of Immigrants from Bosnia and Herzegovina and unemployment rate among population between the ages 20 and 24 in the United States with a correlation coefficient (R) of 0.316 and weighted average of 9.4%, a difference of 27.4%.
Unemployment Among Ages 20 to 24 years Correlation Summary
| Measurement | Immigrants from Belize | Immigrants from Bosnia and Herzegovina |
| Minimum | 1.2% | 0.70% |
| Maximum | 43.6% | 24.7% |
| Range | 42.4% | 24.0% |
| Mean | 12.8% | 9.8% |
| Median | 12.0% | 9.4% |
| Interquartile 25% (IQ1) | 9.6% | 8.1% |
| Interquartile 75% (IQ3) | 15.3% | 10.8% |
| Interquartile Range (IQR) | 5.7% | 2.6% |
| Standard Deviation (Sample) | 7.2% | 4.6% |
| Standard Deviation (Population) | 7.2% | 4.5% |
Similar Demographics by Unemployment Among Ages 20 to 24 years
Demographics Similar to Immigrants from Belize by Unemployment Among Ages 20 to 24 years
In terms of unemployment among ages 20 to 24 years, the demographic groups most similar to Immigrants from Belize are Immigrants from Ghana (11.9%, a difference of 0.030%), Immigrants from Armenia (12.0%, a difference of 0.18%), Cajun (12.0%, a difference of 0.21%), Blackfeet (12.0%, a difference of 0.22%), and Immigrants from Senegal (11.9%, a difference of 0.26%).
| Demographics | Rating | Rank | Unemployment Among Ages 20 to 24 years |
| Immigrants | Ecuador | 0.0 /100 | #287 | Tragic 11.8% |
| U.S. Virgin Islanders | 0.0 /100 | #288 | Tragic 11.8% |
| Belizeans | 0.0 /100 | #289 | Tragic 11.8% |
| Immigrants | Caribbean | 0.0 /100 | #290 | Tragic 11.8% |
| Central American Indians | 0.0 /100 | #291 | Tragic 11.9% |
| Immigrants | Senegal | 0.0 /100 | #292 | Tragic 11.9% |
| Immigrants | Ghana | 0.0 /100 | #293 | Tragic 11.9% |
| Immigrants | Belize | 0.0 /100 | #294 | Tragic 12.0% |
| Immigrants | Armenia | 0.0 /100 | #295 | Tragic 12.0% |
| Cajuns | 0.0 /100 | #296 | Tragic 12.0% |
| Blackfeet | 0.0 /100 | #297 | Tragic 12.0% |
| Lumbee | 0.0 /100 | #298 | Tragic 12.0% |
| Apache | 0.0 /100 | #299 | Tragic 12.0% |
| Spanish American Indians | 0.0 /100 | #300 | Tragic 12.1% |
| Immigrants | Sierra Leone | 0.0 /100 | #301 | Tragic 12.1% |
Demographics Similar to Immigrants from Bosnia and Herzegovina by Unemployment Among Ages 20 to 24 years
In terms of unemployment among ages 20 to 24 years, the demographic groups most similar to Immigrants from Bosnia and Herzegovina are Hmong (9.4%, a difference of 0.010%), Osage (9.4%, a difference of 0.010%), Chinese (9.4%, a difference of 0.13%), Tongan (9.4%, a difference of 0.27%), and Immigrants from Nepal (9.4%, a difference of 0.27%).
| Demographics | Rating | Rank | Unemployment Among Ages 20 to 24 years |
| Slovenes | 100.0 /100 | #14 | Exceptional 9.3% |
| Immigrants | Sudan | 100.0 /100 | #15 | Exceptional 9.3% |
| Danes | 100.0 /100 | #16 | Exceptional 9.3% |
| Czechs | 100.0 /100 | #17 | Exceptional 9.3% |
| Chinese | 100.0 /100 | #18 | Exceptional 9.4% |
| Hmong | 100.0 /100 | #19 | Exceptional 9.4% |
| Osage | 100.0 /100 | #20 | Exceptional 9.4% |
| Immigrants | Bosnia and Herzegovina | 100.0 /100 | #21 | Exceptional 9.4% |
| Tongans | 100.0 /100 | #22 | Exceptional 9.4% |
| Immigrants | Nepal | 100.0 /100 | #23 | Exceptional 9.4% |
| Taiwanese | 100.0 /100 | #24 | Exceptional 9.4% |
| Immigrants | Eritrea | 100.0 /100 | #25 | Exceptional 9.5% |
| Swedes | 100.0 /100 | #26 | Exceptional 9.5% |
| Immigrants | Zimbabwe | 100.0 /100 | #27 | Exceptional 9.5% |
| Immigrants | Afghanistan | 100.0 /100 | #28 | Exceptional 9.5% |