Immigrants from Bahamas vs Slovak Unemployment Among Women with Children Under 6 years
COMPARE
Immigrants from Bahamas
Slovak
Unemployment Among Women with Children Under 6 years
Unemployment Among Women with Children Under 6 years Comparison
Immigrants from Bahamas
Slovaks
9.6%
UNEMPLOYMENT AMONG WOMEN WITH CHILDREN UNDER 6 YEARS
0.0/ 100
METRIC RATING
323rd/ 347
METRIC RANK
8.5%
UNEMPLOYMENT AMONG WOMEN WITH CHILDREN UNDER 6 YEARS
0.1/ 100
METRIC RATING
273rd/ 347
METRIC RANK
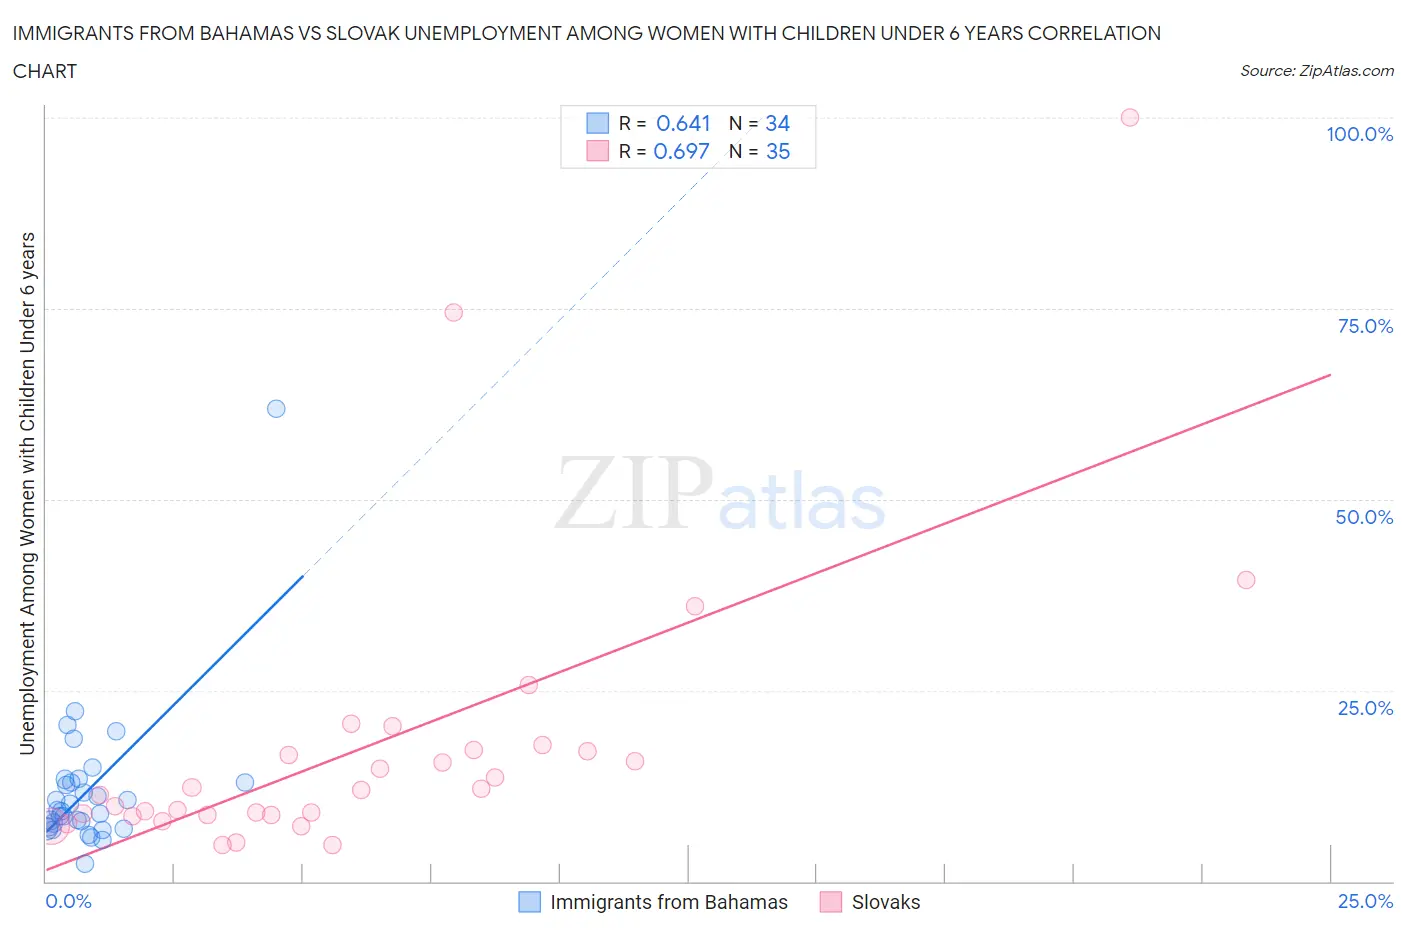
Immigrants from Bahamas vs Slovak Unemployment Among Women with Children Under 6 years Correlation Chart
The statistical analysis conducted on geographies consisting of 94,063,271 people shows a significant positive correlation between the proportion of Immigrants from Bahamas and unemployment rate among women with children under the age of 6 in the United States with a correlation coefficient (R) of 0.641 and weighted average of 9.6%. Similarly, the statistical analysis conducted on geographies consisting of 290,133,423 people shows a significant positive correlation between the proportion of Slovaks and unemployment rate among women with children under the age of 6 in the United States with a correlation coefficient (R) of 0.697 and weighted average of 8.5%, a difference of 13.0%.
Unemployment Among Women with Children Under 6 years Correlation Summary
| Measurement | Immigrants from Bahamas | Slovak |
| Minimum | 2.3% | 4.8% |
| Maximum | 61.8% | 100.0% |
| Range | 59.5% | 95.2% |
| Mean | 11.9% | 17.7% |
| Median | 9.3% | 11.9% |
| Interquartile 25% (IQ1) | 7.1% | 8.6% |
| Interquartile 75% (IQ3) | 12.9% | 17.2% |
| Interquartile Range (IQR) | 5.8% | 8.5% |
| Standard Deviation (Sample) | 9.9% | 19.3% |
| Standard Deviation (Population) | 9.8% | 19.0% |
Similar Demographics by Unemployment Among Women with Children Under 6 years
Demographics Similar to Immigrants from Bahamas by Unemployment Among Women with Children Under 6 years
In terms of unemployment among women with children under 6 years, the demographic groups most similar to Immigrants from Bahamas are Alaska Native (9.6%, a difference of 0.19%), Central American Indian (9.6%, a difference of 0.44%), Potawatomi (9.6%, a difference of 0.50%), Marshallese (9.6%, a difference of 0.55%), and Paiute (9.7%, a difference of 0.70%).
| Demographics | Rating | Rank | Unemployment Among Women with Children Under 6 years |
| Houma | 0.0 /100 | #316 | Tragic 9.4% |
| Dutch West Indians | 0.0 /100 | #317 | Tragic 9.5% |
| Osage | 0.0 /100 | #318 | Tragic 9.5% |
| Marshallese | 0.0 /100 | #319 | Tragic 9.6% |
| Potawatomi | 0.0 /100 | #320 | Tragic 9.6% |
| Central American Indians | 0.0 /100 | #321 | Tragic 9.6% |
| Alaska Natives | 0.0 /100 | #322 | Tragic 9.6% |
| Immigrants | Bahamas | 0.0 /100 | #323 | Tragic 9.6% |
| Paiute | 0.0 /100 | #324 | Tragic 9.7% |
| Choctaw | 0.0 /100 | #325 | Tragic 9.8% |
| Delaware | 0.0 /100 | #326 | Tragic 9.8% |
| Ottawa | 0.0 /100 | #327 | Tragic 9.9% |
| Tohono O'odham | 0.0 /100 | #328 | Tragic 10.2% |
| Blacks/African Americans | 0.0 /100 | #329 | Tragic 10.3% |
| Pennsylvania Germans | 0.0 /100 | #330 | Tragic 10.8% |
Demographics Similar to Slovaks by Unemployment Among Women with Children Under 6 years
In terms of unemployment among women with children under 6 years, the demographic groups most similar to Slovaks are Mexican American Indian (8.5%, a difference of 0.080%), Immigrants from Congo (8.5%, a difference of 0.64%), Immigrants from Senegal (8.5%, a difference of 0.65%), Immigrants from Cameroon (8.6%, a difference of 0.67%), and Immigrants from Latin America (8.6%, a difference of 0.72%).
| Demographics | Rating | Rank | Unemployment Among Women with Children Under 6 years |
| Immigrants | Honduras | 0.3 /100 | #266 | Tragic 8.4% |
| Belizeans | 0.2 /100 | #267 | Tragic 8.4% |
| Sub-Saharan Africans | 0.2 /100 | #268 | Tragic 8.4% |
| Immigrants | Haiti | 0.2 /100 | #269 | Tragic 8.4% |
| Immigrants | Senegal | 0.2 /100 | #270 | Tragic 8.5% |
| Immigrants | Congo | 0.2 /100 | #271 | Tragic 8.5% |
| Mexican American Indians | 0.1 /100 | #272 | Tragic 8.5% |
| Slovaks | 0.1 /100 | #273 | Tragic 8.5% |
| Immigrants | Cameroon | 0.1 /100 | #274 | Tragic 8.6% |
| Immigrants | Latin America | 0.1 /100 | #275 | Tragic 8.6% |
| Yaqui | 0.0 /100 | #276 | Tragic 8.6% |
| Haitians | 0.0 /100 | #277 | Tragic 8.6% |
| Immigrants | Dominica | 0.0 /100 | #278 | Tragic 8.6% |
| Immigrants | Guatemala | 0.0 /100 | #279 | Tragic 8.6% |
| Immigrants | Belize | 0.0 /100 | #280 | Tragic 8.6% |