Immigrants from Bahamas vs Finnish Unemployment Among Women with Children Under 6 years
COMPARE
Immigrants from Bahamas
Finnish
Unemployment Among Women with Children Under 6 years
Unemployment Among Women with Children Under 6 years Comparison
Immigrants from Bahamas
Finns
9.6%
UNEMPLOYMENT AMONG WOMEN WITH CHILDREN UNDER 6 YEARS
0.0/ 100
METRIC RATING
323rd/ 347
METRIC RANK
8.0%
UNEMPLOYMENT AMONG WOMEN WITH CHILDREN UNDER 6 YEARS
5.3/ 100
METRIC RATING
230th/ 347
METRIC RANK
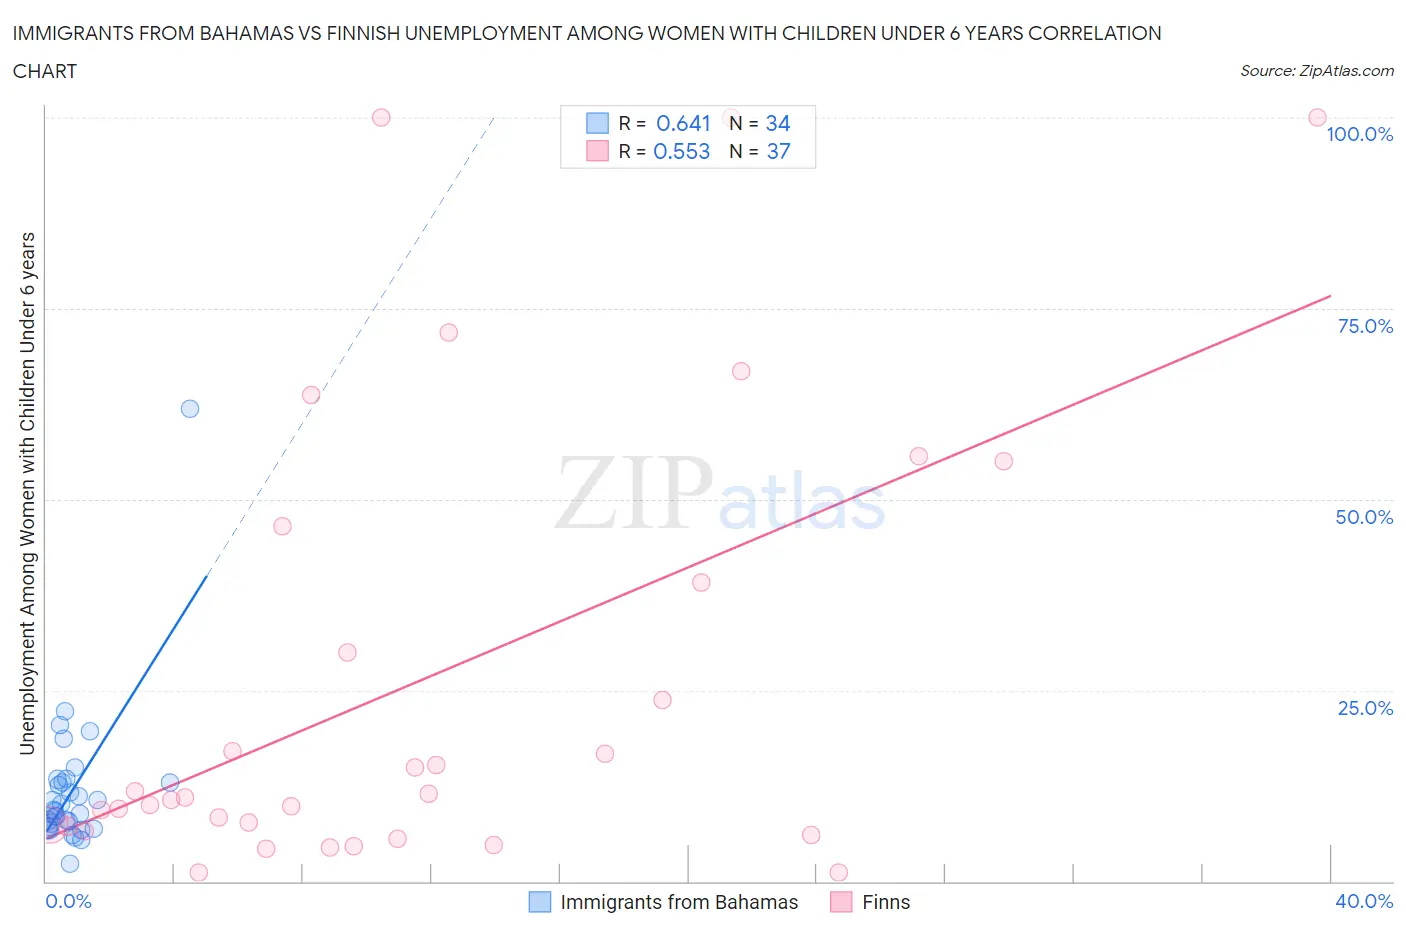
Immigrants from Bahamas vs Finnish Unemployment Among Women with Children Under 6 years Correlation Chart
The statistical analysis conducted on geographies consisting of 94,063,271 people shows a significant positive correlation between the proportion of Immigrants from Bahamas and unemployment rate among women with children under the age of 6 in the United States with a correlation coefficient (R) of 0.641 and weighted average of 9.6%. Similarly, the statistical analysis conducted on geographies consisting of 294,495,197 people shows a substantial positive correlation between the proportion of Finns and unemployment rate among women with children under the age of 6 in the United States with a correlation coefficient (R) of 0.553 and weighted average of 8.0%, a difference of 20.2%.
Unemployment Among Women with Children Under 6 years Correlation Summary
| Measurement | Immigrants from Bahamas | Finnish |
| Minimum | 2.3% | 1.1% |
| Maximum | 61.8% | 100.0% |
| Range | 59.5% | 98.9% |
| Mean | 11.9% | 26.2% |
| Median | 9.3% | 11.0% |
| Interquartile 25% (IQ1) | 7.1% | 6.9% |
| Interquartile 75% (IQ3) | 12.9% | 42.8% |
| Interquartile Range (IQR) | 5.8% | 35.9% |
| Standard Deviation (Sample) | 9.9% | 29.8% |
| Standard Deviation (Population) | 9.8% | 29.4% |
Similar Demographics by Unemployment Among Women with Children Under 6 years
Demographics Similar to Immigrants from Bahamas by Unemployment Among Women with Children Under 6 years
In terms of unemployment among women with children under 6 years, the demographic groups most similar to Immigrants from Bahamas are Alaska Native (9.6%, a difference of 0.19%), Central American Indian (9.6%, a difference of 0.44%), Potawatomi (9.6%, a difference of 0.50%), Marshallese (9.6%, a difference of 0.55%), and Paiute (9.7%, a difference of 0.70%).
| Demographics | Rating | Rank | Unemployment Among Women with Children Under 6 years |
| Houma | 0.0 /100 | #316 | Tragic 9.4% |
| Dutch West Indians | 0.0 /100 | #317 | Tragic 9.5% |
| Osage | 0.0 /100 | #318 | Tragic 9.5% |
| Marshallese | 0.0 /100 | #319 | Tragic 9.6% |
| Potawatomi | 0.0 /100 | #320 | Tragic 9.6% |
| Central American Indians | 0.0 /100 | #321 | Tragic 9.6% |
| Alaska Natives | 0.0 /100 | #322 | Tragic 9.6% |
| Immigrants | Bahamas | 0.0 /100 | #323 | Tragic 9.6% |
| Paiute | 0.0 /100 | #324 | Tragic 9.7% |
| Choctaw | 0.0 /100 | #325 | Tragic 9.8% |
| Delaware | 0.0 /100 | #326 | Tragic 9.8% |
| Ottawa | 0.0 /100 | #327 | Tragic 9.9% |
| Tohono O'odham | 0.0 /100 | #328 | Tragic 10.2% |
| Blacks/African Americans | 0.0 /100 | #329 | Tragic 10.3% |
| Pennsylvania Germans | 0.0 /100 | #330 | Tragic 10.8% |
Demographics Similar to Finns by Unemployment Among Women with Children Under 6 years
In terms of unemployment among women with children under 6 years, the demographic groups most similar to Finns are Trinidadian and Tobagonian (8.0%, a difference of 0.0%), Salvadoran (8.0%, a difference of 0.070%), Welsh (8.0%, a difference of 0.090%), Immigrants from Trinidad and Tobago (8.0%, a difference of 0.18%), and Immigrants from Sudan (8.0%, a difference of 0.22%).
| Demographics | Rating | Rank | Unemployment Among Women with Children Under 6 years |
| Carpatho Rusyns | 7.8 /100 | #223 | Tragic 8.0% |
| English | 7.2 /100 | #224 | Tragic 8.0% |
| Germans | 7.0 /100 | #225 | Tragic 8.0% |
| Senegalese | 6.2 /100 | #226 | Tragic 8.0% |
| Portuguese | 6.2 /100 | #227 | Tragic 8.0% |
| Immigrants | Sudan | 6.0 /100 | #228 | Tragic 8.0% |
| Salvadorans | 5.5 /100 | #229 | Tragic 8.0% |
| Finns | 5.3 /100 | #230 | Tragic 8.0% |
| Trinidadians and Tobagonians | 5.3 /100 | #231 | Tragic 8.0% |
| Welsh | 5.0 /100 | #232 | Tragic 8.0% |
| Immigrants | Trinidad and Tobago | 4.8 /100 | #233 | Tragic 8.0% |
| Kiowa | 4.4 /100 | #234 | Tragic 8.0% |
| Comanche | 4.3 /100 | #235 | Tragic 8.0% |
| Immigrants | Barbados | 4.2 /100 | #236 | Tragic 8.0% |
| Immigrants | Costa Rica | 4.1 /100 | #237 | Tragic 8.0% |