Taiwanese vs Slovak Unemployment Among Women with Children Under 6 years
COMPARE
Taiwanese
Slovak
Unemployment Among Women with Children Under 6 years
Unemployment Among Women with Children Under 6 years Comparison
Taiwanese
Slovaks
6.1%
UNEMPLOYMENT AMONG WOMEN WITH CHILDREN UNDER 6 YEARS
100.0/ 100
METRIC RATING
7th/ 347
METRIC RANK
8.5%
UNEMPLOYMENT AMONG WOMEN WITH CHILDREN UNDER 6 YEARS
0.1/ 100
METRIC RATING
273rd/ 347
METRIC RANK
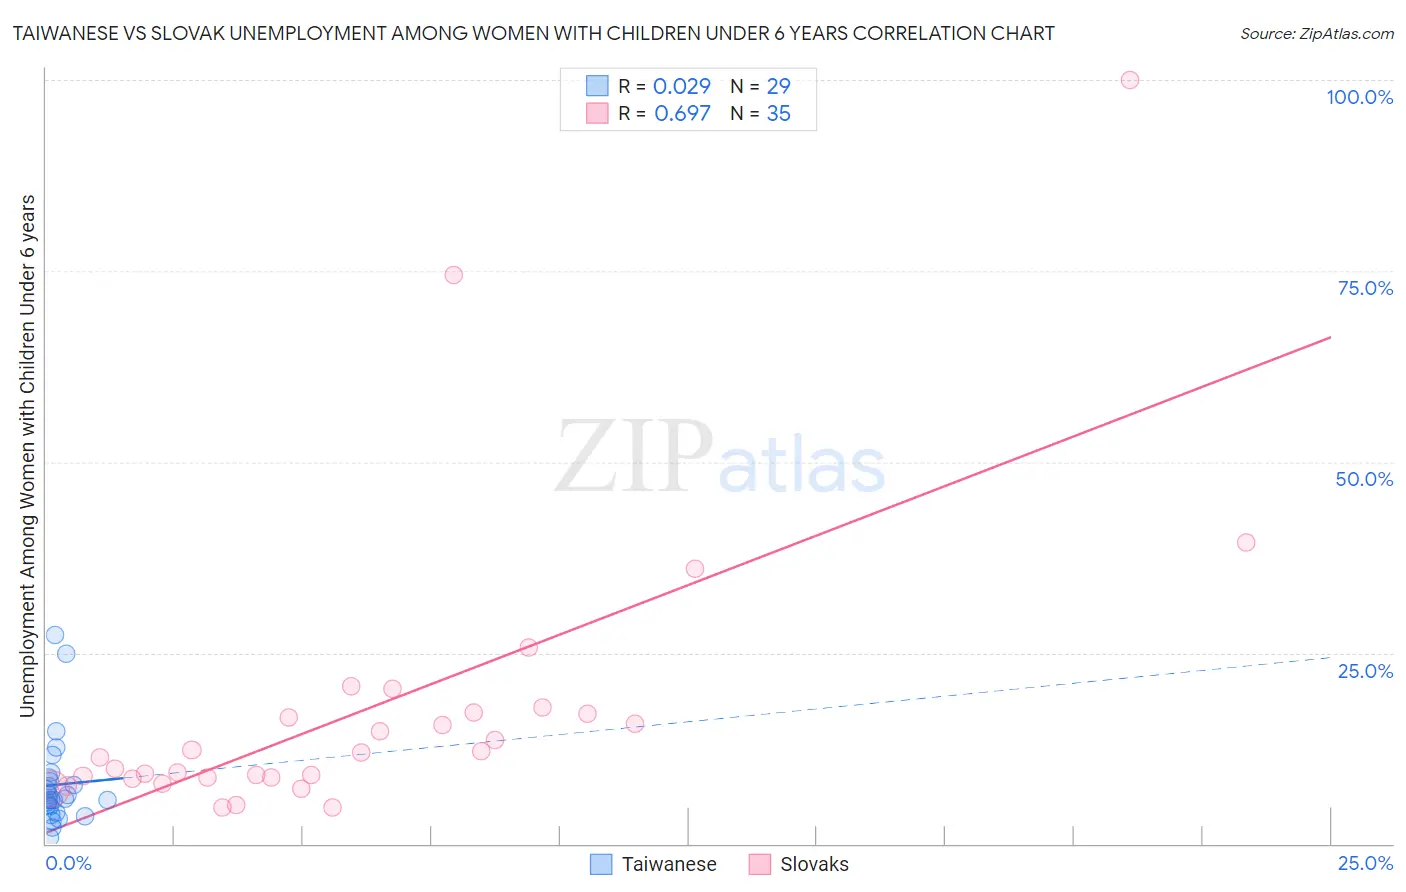
Taiwanese vs Slovak Unemployment Among Women with Children Under 6 years Correlation Chart
The statistical analysis conducted on geographies consisting of 30,738,294 people shows no correlation between the proportion of Taiwanese and unemployment rate among women with children under the age of 6 in the United States with a correlation coefficient (R) of 0.029 and weighted average of 6.1%. Similarly, the statistical analysis conducted on geographies consisting of 290,133,423 people shows a significant positive correlation between the proportion of Slovaks and unemployment rate among women with children under the age of 6 in the United States with a correlation coefficient (R) of 0.697 and weighted average of 8.5%, a difference of 40.2%.
Unemployment Among Women with Children Under 6 years Correlation Summary
| Measurement | Taiwanese | Slovak |
| Minimum | 0.90% | 4.8% |
| Maximum | 27.3% | 100.0% |
| Range | 26.4% | 95.2% |
| Mean | 7.7% | 17.7% |
| Median | 5.9% | 11.9% |
| Interquartile 25% (IQ1) | 4.5% | 8.6% |
| Interquartile 75% (IQ3) | 8.4% | 17.2% |
| Interquartile Range (IQR) | 3.9% | 8.5% |
| Standard Deviation (Sample) | 5.9% | 19.3% |
| Standard Deviation (Population) | 5.8% | 19.0% |
Similar Demographics by Unemployment Among Women with Children Under 6 years
Demographics Similar to Taiwanese by Unemployment Among Women with Children Under 6 years
In terms of unemployment among women with children under 6 years, the demographic groups most similar to Taiwanese are Immigrants from India (6.1%, a difference of 0.49%), Immigrants from Taiwan (6.0%, a difference of 0.52%), Filipino (6.1%, a difference of 0.94%), Cape Verdean (5.9%, a difference of 2.2%), and Immigrants from China (6.2%, a difference of 2.4%).
| Demographics | Rating | Rank | Unemployment Among Women with Children Under 6 years |
| Immigrants | Cabo Verde | 100.0 /100 | #1 | Exceptional 5.4% |
| Immigrants | Hong Kong | 100.0 /100 | #2 | Exceptional 5.8% |
| Okinawans | 100.0 /100 | #3 | Exceptional 5.8% |
| Cambodians | 100.0 /100 | #4 | Exceptional 5.9% |
| Cape Verdeans | 100.0 /100 | #5 | Exceptional 5.9% |
| Immigrants | Taiwan | 100.0 /100 | #6 | Exceptional 6.0% |
| Taiwanese | 100.0 /100 | #7 | Exceptional 6.1% |
| Immigrants | India | 100.0 /100 | #8 | Exceptional 6.1% |
| Filipinos | 100.0 /100 | #9 | Exceptional 6.1% |
| Immigrants | China | 100.0 /100 | #10 | Exceptional 6.2% |
| Indians (Asian) | 100.0 /100 | #11 | Exceptional 6.3% |
| Immigrants | Singapore | 100.0 /100 | #12 | Exceptional 6.3% |
| Immigrants | Eastern Asia | 100.0 /100 | #13 | Exceptional 6.3% |
| Immigrants | Bulgaria | 100.0 /100 | #14 | Exceptional 6.3% |
| Thais | 100.0 /100 | #15 | Exceptional 6.3% |
Demographics Similar to Slovaks by Unemployment Among Women with Children Under 6 years
In terms of unemployment among women with children under 6 years, the demographic groups most similar to Slovaks are Mexican American Indian (8.5%, a difference of 0.080%), Immigrants from Congo (8.5%, a difference of 0.64%), Immigrants from Senegal (8.5%, a difference of 0.65%), Immigrants from Cameroon (8.6%, a difference of 0.67%), and Immigrants from Latin America (8.6%, a difference of 0.72%).
| Demographics | Rating | Rank | Unemployment Among Women with Children Under 6 years |
| Immigrants | Honduras | 0.3 /100 | #266 | Tragic 8.4% |
| Belizeans | 0.2 /100 | #267 | Tragic 8.4% |
| Sub-Saharan Africans | 0.2 /100 | #268 | Tragic 8.4% |
| Immigrants | Haiti | 0.2 /100 | #269 | Tragic 8.4% |
| Immigrants | Senegal | 0.2 /100 | #270 | Tragic 8.5% |
| Immigrants | Congo | 0.2 /100 | #271 | Tragic 8.5% |
| Mexican American Indians | 0.1 /100 | #272 | Tragic 8.5% |
| Slovaks | 0.1 /100 | #273 | Tragic 8.5% |
| Immigrants | Cameroon | 0.1 /100 | #274 | Tragic 8.6% |
| Immigrants | Latin America | 0.1 /100 | #275 | Tragic 8.6% |
| Yaqui | 0.0 /100 | #276 | Tragic 8.6% |
| Haitians | 0.0 /100 | #277 | Tragic 8.6% |
| Immigrants | Dominica | 0.0 /100 | #278 | Tragic 8.6% |
| Immigrants | Guatemala | 0.0 /100 | #279 | Tragic 8.6% |
| Immigrants | Belize | 0.0 /100 | #280 | Tragic 8.6% |