Immigrants from Bahamas vs Slovak Currently Married
COMPARE
Immigrants from Bahamas
Slovak
Currently Married
Currently Married Comparison
Immigrants from Bahamas
Slovaks
41.9%
CURRENTLY MARRIED
0.0/ 100
METRIC RATING
304th/ 347
METRIC RANK
48.3%
CURRENTLY MARRIED
98.2/ 100
METRIC RATING
67th/ 347
METRIC RANK
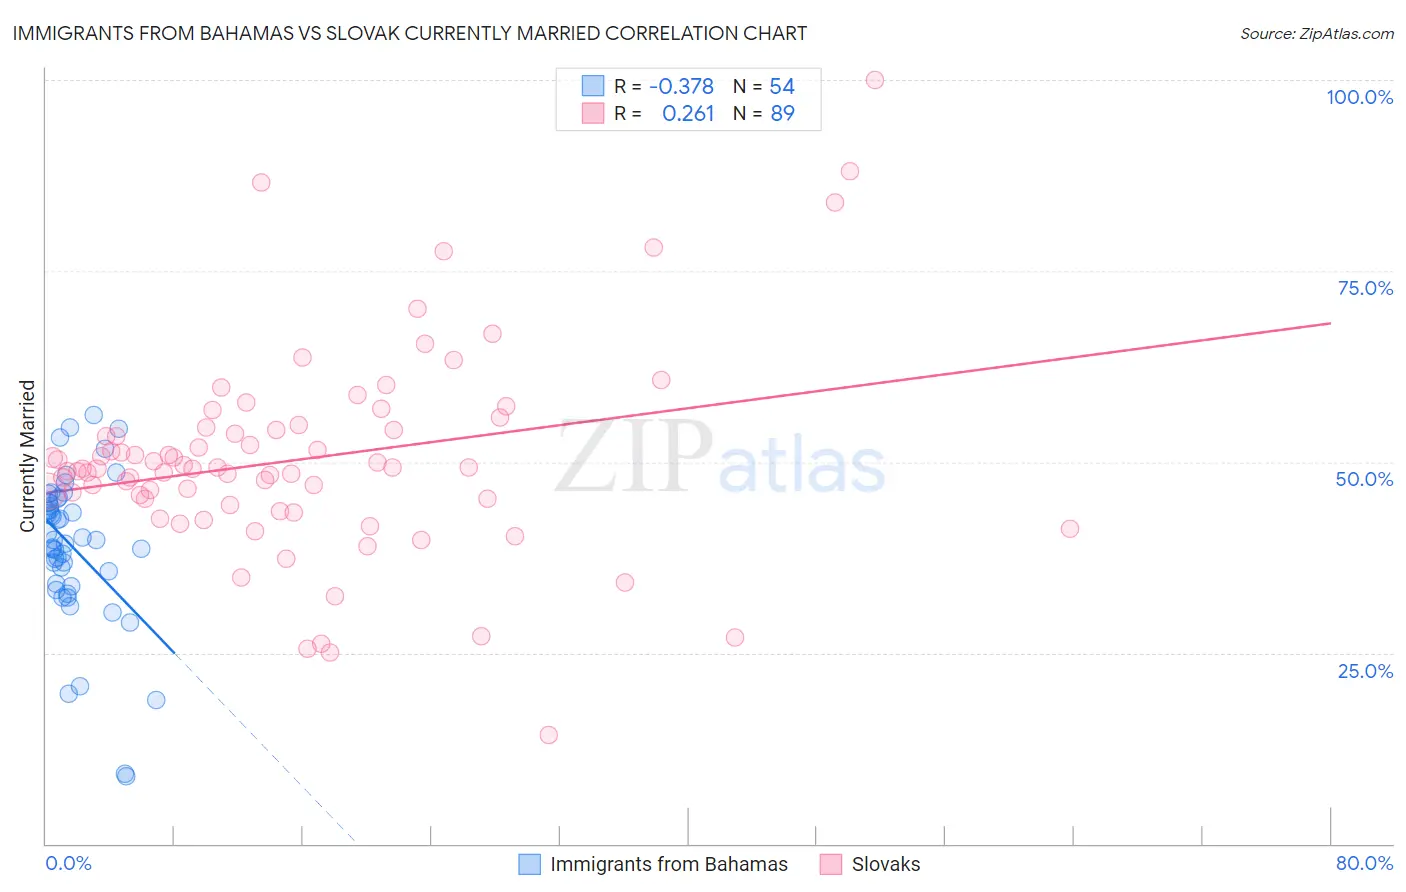
Immigrants from Bahamas vs Slovak Currently Married Correlation Chart
The statistical analysis conducted on geographies consisting of 104,648,272 people shows a mild negative correlation between the proportion of Immigrants from Bahamas and percentage of population currently married in the United States with a correlation coefficient (R) of -0.378 and weighted average of 41.9%. Similarly, the statistical analysis conducted on geographies consisting of 397,850,297 people shows a weak positive correlation between the proportion of Slovaks and percentage of population currently married in the United States with a correlation coefficient (R) of 0.261 and weighted average of 48.3%, a difference of 15.4%.
Currently Married Correlation Summary
| Measurement | Immigrants from Bahamas | Slovak |
| Minimum | 8.9% | 14.2% |
| Maximum | 56.2% | 100.0% |
| Range | 47.3% | 85.8% |
| Mean | 38.9% | 50.4% |
| Median | 39.7% | 49.2% |
| Interquartile 25% (IQ1) | 34.0% | 44.7% |
| Interquartile 75% (IQ3) | 44.7% | 54.4% |
| Interquartile Range (IQR) | 10.6% | 9.7% |
| Standard Deviation (Sample) | 9.9% | 13.5% |
| Standard Deviation (Population) | 9.8% | 13.5% |
Similar Demographics by Currently Married
Demographics Similar to Immigrants from Bahamas by Currently Married
In terms of currently married, the demographic groups most similar to Immigrants from Bahamas are Immigrants from Trinidad and Tobago (41.9%, a difference of 0.030%), Immigrants from Guyana (41.9%, a difference of 0.040%), Sioux (41.9%, a difference of 0.11%), Immigrants from Zaire (42.0%, a difference of 0.13%), and African (41.8%, a difference of 0.18%).
| Demographics | Rating | Rank | Currently Married |
| Cheyenne | 0.0 /100 | #297 | Tragic 42.2% |
| Immigrants | Honduras | 0.0 /100 | #298 | Tragic 42.2% |
| Liberians | 0.0 /100 | #299 | Tragic 42.2% |
| Belizeans | 0.0 /100 | #300 | Tragic 42.2% |
| Immigrants | Yemen | 0.0 /100 | #301 | Tragic 42.1% |
| Immigrants | Zaire | 0.0 /100 | #302 | Tragic 42.0% |
| Sioux | 0.0 /100 | #303 | Tragic 41.9% |
| Immigrants | Bahamas | 0.0 /100 | #304 | Tragic 41.9% |
| Immigrants | Trinidad and Tobago | 0.0 /100 | #305 | Tragic 41.9% |
| Immigrants | Guyana | 0.0 /100 | #306 | Tragic 41.9% |
| Africans | 0.0 /100 | #307 | Tragic 41.8% |
| Immigrants | Belize | 0.0 /100 | #308 | Tragic 41.8% |
| Immigrants | Liberia | 0.0 /100 | #309 | Tragic 41.8% |
| Guyanese | 0.0 /100 | #310 | Tragic 41.6% |
| Trinidadians and Tobagonians | 0.0 /100 | #311 | Tragic 41.5% |
Demographics Similar to Slovaks by Currently Married
In terms of currently married, the demographic groups most similar to Slovaks are Tongan (48.3%, a difference of 0.010%), Immigrants from England (48.3%, a difference of 0.010%), Canadian (48.3%, a difference of 0.020%), Ukrainian (48.4%, a difference of 0.040%), and Slavic (48.4%, a difference of 0.050%).
| Demographics | Rating | Rank | Currently Married |
| Immigrants | Romania | 98.5 /100 | #60 | Exceptional 48.4% |
| Romanians | 98.5 /100 | #61 | Exceptional 48.4% |
| Asians | 98.5 /100 | #62 | Exceptional 48.4% |
| Slavs | 98.3 /100 | #63 | Exceptional 48.4% |
| Immigrants | Czechoslovakia | 98.3 /100 | #64 | Exceptional 48.4% |
| Ukrainians | 98.3 /100 | #65 | Exceptional 48.4% |
| Tongans | 98.2 /100 | #66 | Exceptional 48.3% |
| Slovaks | 98.2 /100 | #67 | Exceptional 48.3% |
| Immigrants | England | 98.2 /100 | #68 | Exceptional 48.3% |
| Canadians | 98.1 /100 | #69 | Exceptional 48.3% |
| Immigrants | Asia | 97.9 /100 | #70 | Exceptional 48.3% |
| Macedonians | 97.9 /100 | #71 | Exceptional 48.3% |
| Immigrants | Lebanon | 97.6 /100 | #72 | Exceptional 48.2% |
| Immigrants | Eastern Asia | 97.5 /100 | #73 | Exceptional 48.2% |
| Estonians | 97.4 /100 | #74 | Exceptional 48.2% |